In This Article
- Why Per-Loan Cost Is the Wrong KPI Without Cost-to-Originate by Channel
- Strategy 1: See It First with Mortgage BI Cost-to-Originate Dashboards
- Strategy 2: Eliminate the Biggest Cost Bucket with MortgageExchange
- Strategy 3: Drop LOS Infrastructure Cost with Calyx PointCentral on Azure
- Where M365 Guardian Fits: One Operating Model Across Three Workloads
- KPIs Credit Unions Should Track to Measure Mortgage BI ROI
- The Bottom Line
- Frequently Asked Questions
Credit unions are originating more mortgages than they have in years. According to the National Credit Union Administration's Quarterly U.S. Credit Union Data Summary, federally insured credit unions have continued to grow their first mortgage real estate portfolios through 2024 and into 2025. That growth is welcome news for member-focused lenders that competed hard for market share through a difficult rate cycle. The problem is what comes next.
The Mortgage Bankers Association reported that independent mortgage banks averaged $11,061 in total production expense per loan across full-year 2023, with that figure climbing to $12,485 in the fourth quarter alone as volume softened and fixed costs got spread across fewer loans. Credit unions typically run leaner than independent mortgage banks because of lower marketing spend, lower compensation structures, and member loyalty that reduces acquisition costs. Even so, the per-loan number for most credit unions sits uncomfortably close to the industry average once every indirect cost is counted honestly.
When per-loan cost is reported as a single number rolled up at the quarterly close, every downstream decision suffers. Budgets get misallocated. Efficiency gains go unnoticed. Pricing decisions hide losses inside what looks like profitable production. And the gap between credit unions that can see cost-to-originate by channel, by loan officer, and by product type and those that cannot keeps widening, examination cycle after examination cycle.
This article walks through three product-specific strategies that reduce origination costs without cutting corners on member service or compliance. The strategies are sequenced deliberately. Mortgage BI surfaces cost-to-originate by channel and loan officer first, because you cannot reduce what you cannot measure. MortgageExchange eliminates manual re-keying between loan origination, core banking, servicing, and wires next, because that is where the largest single block of per-loan cost lives at most credit unions. Calyx PointCentral on Azure drops LOS infrastructure cost third, by moving PointCentral hosting off owned hardware onto an Azure environment ABT operates. M365 Guardian closes by giving the credit union one operating model across all three workloads instead of three integration platforms to manage separately.
Why Per-Loan Cost Is the Wrong KPI Without Cost-to-Originate by Channel
The mortgage business is brutal on margins. Rate cycles compress profitability. Compliance overhead never goes down. And member expectations for digital experience keep rising while the cost of providing that experience climbs with every new vendor in the stack. Credit unions face all of those pressures with thinner staffing than the largest independent mortgage banks and tighter regulatory scrutiny from the NCUA than non-credit-union lenders see.
The institutions that thrive in this environment do one thing first that most do not. They stop treating per-loan cost as a single quarterly number and start tracking cost-to-originate by channel, by loan officer, and by product type. The channel cost difference between a member who pre-qualifies through a self-service portal and a member who walks into a branch and asks a loan officer to walk through options is often three to five hundred dollars per loan. The loan officer cost variance between a top quartile producer and a bottom quartile producer at the same credit union is often eight hundred to twelve hundred dollars per loan once exception handling and rework are honestly allocated. None of that variance shows up in a single rolled-up per-loan-cost report.
Without cost-to-originate visibility, every other strategy is an educated guess. Pricing decisions get made against the wrong cost basis. Technology investments target the wrong bottlenecks. Compensation models reward production volume without accounting for the staff time those volumes consume. The fix is not a new spreadsheet or a quarterly budget review. The fix is a dashboard the CFO and the head of lending look at the same way they look at deposit growth or net charge-offs, refreshed daily, drilled down by the dimensions that drive cost variance at this specific credit union.
Why This Matters for Financial Institutions
The Consumer Financial Protection Bureau's Home Mortgage Disclosure Act data shows credit unions accounted for roughly 8 to 9 percent of total first-lien mortgage originations in recent reporting years, a share that has held relatively steady while overall market volume swung dramatically. That stability is a strength when rates spike and competitors retreat. It also means every dollar of unnecessary per-loan cost compounds across more mortgages than most credit union leadership teams realize. A $500 reduction in true per-loan cost at a credit union closing 600 mortgages a year is $300,000 directly to the bottom line, every year.
Strategy 1: See It First with Mortgage BI Cost-to-Originate Dashboards
Most credit unions own everything they need to produce cost-to-originate dashboards already. They have a loan origination system that captures every fee, every staff touchpoint, and every closing timeline. They have a core banking platform that captures every funded loan and every servicing handoff. They have a Microsoft 365 tenant that almost always includes Power BI Pro entitlements through E3, E5, or Business Premium licensing. What they do not have is a way to model the LOS, core, and servicing data together in a schema purpose-built for mortgage cost analysis, dashboards that surface the right cost dimensions for credit union leadership, and a refresh cadence that makes the numbers operational rather than retrospective.
That gap is what ABT's Mortgage BI closes. Mortgage BI is a Microsoft Power BI template library and a Microsoft Fabric OneLake schema pack pre-built for the loan origination systems credit unions actually run (ICE Encompass, Calyx PointCentral, MeridianLink, Mortgage Cadence) along with the major credit union cores Fiserv DNA, Symitar, Corelation. Credit unions already paying for Power BI through Microsoft 365 ship the dashboard work in days rather than months, because the data model, the transformations, and the report templates are already done.
The headline dashboard tile is cost-to-originate by channel, refreshed daily, drilled into by loan officer and product type. The supporting tiles answer the questions a CFO actually asks when the channel tile reveals an outlier: average days to close by loan officer, exception handling minutes per file, manual data entry incidents per closed loan, and pull-through rate by referral source. Same data, same OneLake foundation, mortgage-specific schema and report templates that fit how credit unions run lending. For the underlying Microsoft Fabric and OneLake architecture credit unions standardize on, see the companion guide on Business Intelligence for Financial Institutions.
A credit union's executive team sees mortgage production cost reported quarterly as a single labor and processing line item. Technology licenses are tracked under IT. Compliance staff time is rolled into a general overhead category. When the team plans next year's budget, mortgage production looks profitable because the visible numbers are flattering. The real cost-to-originate by channel and by loan officer stays hidden until an examiner asks for it or a CFO digs through three departments to construct it manually.
The same credit union has a Power BI dashboard that shows cost-to-originate by channel and by loan officer every morning. The dashboard pulls from the Fabric OneLake schema that joins LOS data with core funding records and servicing handoffs. Outliers surface within days, not quarters. Pricing decisions, technology investments, and staffing models all reference the same operational cost basis. Margin compression gets caught in week one of a downward trend instead of at the year-end close meeting.
What Mortgage BI ships in the first 30 days:
- Cost-to-originate by channel dashboard. Per-loan fully-loaded cost broken out by referral channel, refreshed daily from LOS and core data. Drillthrough by loan officer, product type, and closing month. Reveals the channel-mix decisions that compound to several hundred dollars per loan in either direction.
- Loan officer productivity dashboard. Loans per officer per month, average days to close by officer, exception rate by officer, and per-loan staff-touch count by officer. Identifies the structural differences between top and bottom quartile producers that compensation models often miss.
- Compliance and operational dashboard. Manual data entry incidents per closed loan, compliance exceptions traced back to origination, member touchpoints per loan, and pull-through rate. These are the leading indicators NCUA examiners increasingly ask credit unions to demonstrate they monitor.
- MBA benchmark comparison view. Same metrics, benchmarked against the Mortgage Bankers Performance Report quarterly so credit union leadership can pressure-test their numbers against the industry rather than only against last quarter.
Visibility is the foundation. Every other strategy depends on knowing where money actually goes. Once cost-to-originate is operational rather than retrospective, the next question writes itself: where is the biggest bucket of per-loan cost actually leaking?
Strategy 2: Eliminate the Biggest Cost Bucket with MortgageExchange
For most credit unions, the answer is the same. The biggest single bucket of avoidable per-loan cost is staff time spent retyping data between the loan origination system, the core, the servicing platform, and the wire system. A loan that closes in Encompass but takes three days to board into Symitar because somebody has to retype the data is a loan that cost more than it should. A wire that gets cut from a spreadsheet copied out of the LOS instead of pushed automatically from the post-close record is a wire that risks an exception. A servicing handoff that requires a post-closer to compare two screens and reconcile fields is a handoff that adds 45 to 90 minutes of fully-loaded staff time per file, every file.
Industry estimates of manual data transcription error rates run between 1 and 5 percent. For a credit union closing 50 mortgages a month, that translates to between six and thirty rework events monthly, each consuming staff time that could be applied to new business plus loan-condition exposure that triggers downstream compliance review. At roughly forty dollars per hour fully loaded and 60 minutes per rework event on average, the transcription rework cost alone runs $300 to $2,700 per month, before counting the loans that close late because of it. Multiply that across a 600-loan-per-year credit union and the avoidable cost compounds into six figures annually for the median institution.
That is what ABT's MortgageExchange eliminates. MortgageExchange is a managed integration platform that handles LOS-to-core boarding, servicing handoffs, wire instructions, post-closing data flow, document indexing, and the long tail of point-to-point connections credit unions rebuild every time a vendor pushes an update. The platform runs in an Azure environment that ABT operates, logs every data movement for audit purposes, and presents a single integration governance layer instead of a portfolio of brittle custom connectors.
Credit unions running MortgageExchange today are not theoretical case studies. Bay Federal Credit Union uses MortgageExchange to push post-closing data from Encompass into Symitar without staff retyping a single field. The credit union eliminated three full-time-equivalent days of weekly post-close work and the documentation trail satisfies NCUA examiners on the first ask. Patelco Credit Union broke a mortgage data bottleneck that had blocked their integration team for years, consolidating LOS-to-core boarding, servicing handoffs, and wire instructions under a single managed integration. Tower Federal Credit Union unified five disconnected mortgage systems under one MortgageExchange operating layer, reducing the number of vendor relationships its integration team had to manage from five down to one.

Where MortgageExchange takes cost out at most credit unions:
- Post-closing LOS-to-core boarding. Every funded loan flows from the LOS into the core without staff retyping a single field. Bay FCU's three-FTE-days-per-week of post-close work disappeared this way. The same pattern applies whether the core is Symitar, Fiserv DNA, Corelation, or another platform.
- Servicing handoffs without manual reconciliation. Closed loans hand off cleanly from origination to servicing with the data already aligned. Post-closers stop reconciling screens. Servicing supervisors stop fielding tickets about boarding gaps. The audit trail produces the documentation NCUA examiners ask for without manual collation.
- Wire instructions pushed from the post-close record. Every wire derives from a single canonical source, the funded loan record, instead of a spreadsheet copied out of the LOS. Wire exception rate drops because the upstream data integrity is no longer a copy-paste step away from corrupt.
- Document indexing across LOS, core, and the document repository. Closing documents, post-close conditions, and servicing paperwork land in the right loan file automatically. Staff stop hunting for documents during examination prep and compliance review.
- Vendor update resilience. When Encompass, PointCentral, Symitar, or any other platform pushes an update, the managed integration layer absorbs the change. The credit union's integration team is not rebuilding point-to-point connectors every quarter.
The 2025 MeridianLink industry survey reported that a majority of credit union digital leaders planned to increase technology budgets in 2026. The institutions getting measurable cost reductions from those budgets are the ones spending on integration and workflow automation rather than net-new platforms. MortgageExchange concentrates that spend where the dollars actually come out (manual re-keying) and gives the integration team back the time they were spending on connector maintenance. For credit unions evaluating where MortgageExchange would take the most cost out of their current stack, the next sections describe the LOS infrastructure cost it sits on top of and the operating model that runs across all of it.
Strategy 3: Drop LOS Infrastructure Cost with Calyx PointCentral on Azure
For credit unions running Calyx PointCentral as their loan origination system, the next cost bucket sits under the application itself. Running PointCentral on owned hardware means buying servers, refreshing them on a three-year cycle, paying for the rack and the power and the cooling, staffing the IT team that patches and monitors them, and rebuilding the security posture every NCUA examination cycle. None of that is differentiating for the credit union. It is infrastructure the institution pays for because PointCentral has to run somewhere.
ABT hosts Calyx PointCentral on Azure as a managed service. Each credit union runs in a dedicated Azure environment that ABT operates as the partner of record. The underlying architecture is purpose-fit for PointCentral rather than oversized for marketing reasons: an Azure B2s virtual machine with LRS or GRS storage depending on the disaster recovery posture the credit union needs, paired with the Azure security controls (backup retention, snapshot policy, role-based access, Azure Monitor) that come with the platform. The credit union does not buy hardware. The credit union does not refresh hardware. The credit union does not staff a server team to patch PointCentral or its Windows host operating system.
The cost framing is straightforward. Running PointCentral on an Azure environment that ABT operates costs less than buying, refreshing, and securing on-prem hardware on a three-year cycle once the fully-loaded cost of staffing is honestly counted. The security and compliance posture inherits the Microsoft Azure platform controls rather than being rebuilt in-house every audit cycle. SOC 2 Type II coverage runs through ABT as the partner of record. The credit union's IT team gets the time back to focus on member-facing technology instead of the LOS infrastructure layer.
The terminology matters here because examiners and IT directors notice it. ABT hosts Calyx PointCentral on Azure, because Azure is customer-controlled cloud infrastructure that ABT operates. ABT manages the Microsoft 365 tenant the credit union runs on, because Microsoft owns the M365 infrastructure, ABT manages the tenant via delegated admin permissions. The two verbs describe different roles and reading either of them precisely tells a CISO that ABT understands its own scope. For credit unions running Encompass alongside or instead of PointCentral, the same Azure-hosted operating model applies to Encompass, with the compliance posture described in the companion guide on staying audit-ready with Encompass and Calyx.
What credit unions get when ABT hosts PointCentral on Azure:
- Dedicated Azure environment per credit union. A single-tenant footprint rather than a shared multi-tenant LOS. The B2s VM with LRS or GRS storage is sized for PointCentral workloads with capacity headroom for closing-day peaks.
- Inherited Microsoft Azure security controls. Network segmentation, role-based access, Azure Monitor alerts, encrypted backups, and the platform-level controls Microsoft publishes through its Service Trust Portal. Audit evidence comes from the platform, not from manual screenshots.
- SOC 2 Type II coverage through ABT as the partner of record. Examiners get the attestation they expect to see for any cloud-hosted production system that touches member loan data.
- Backup and disaster recovery policy that matches NCUA business continuity expectations. Snapshot retention, geo-redundant copy where required, and documented recovery time and recovery point objectives that examiners can review without the credit union assembling them on demand.
- No on-prem hardware refresh cycle. The three-year server refresh disappears as a capital line. The data center power, cooling, and rack expense disappears. The internal IT team gets the hours back to focus on the LOS user experience and member-facing capabilities rather than patching Windows Server on a quarterly Patch Tuesday rotation.
Three strategies in. Cost-to-originate is now visible through Mortgage BI. The biggest single bucket of avoidable cost is eliminated through MortgageExchange. The infrastructure cost under the LOS itself is dropped through Calyx PointCentral on Azure. What is left is the operating model that runs across all three workloads, and that is where M365 Guardian closes.
Where M365 Guardian Fits: One Operating Model Across Three Workloads
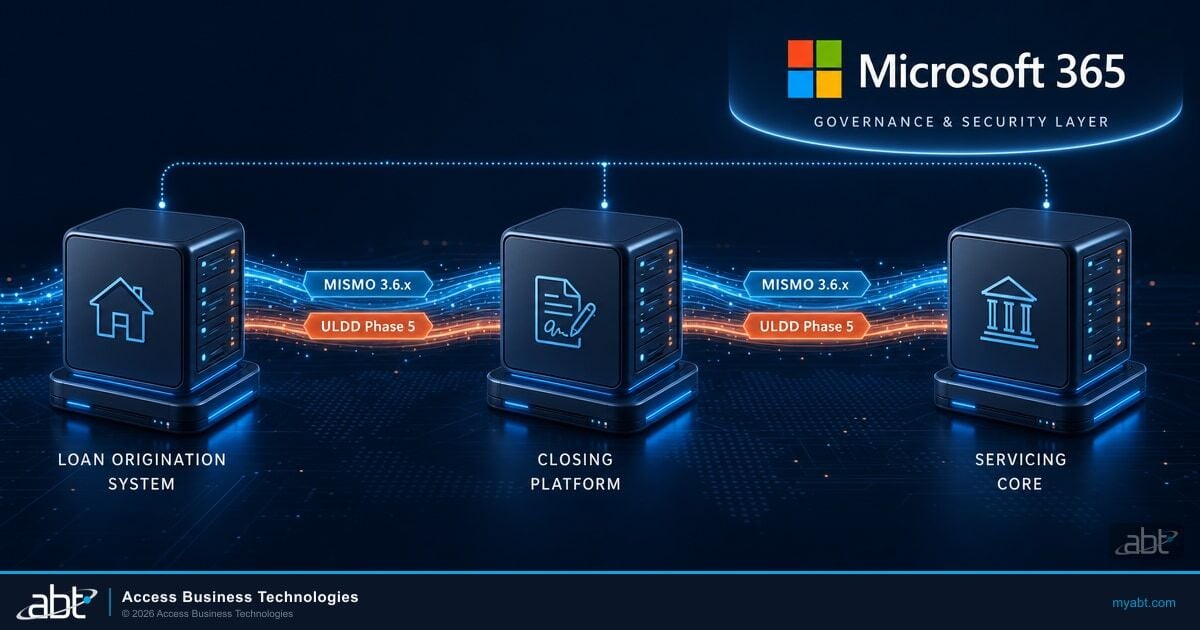
Mortgage BI runs on Power BI and Microsoft Fabric inside the credit union's Microsoft 365 tenant. MortgageExchange runs on an Azure environment ABT operates. Calyx PointCentral runs on an Azure environment ABT operates. The credit union's email, document collaboration, identity, and device management all run inside the same Microsoft 365 tenant. Without a coordinated operating model, the credit union ends up with three integration platforms to manage, three security perimeters to audit, three vendor relationships to track, and three sets of compliance evidence to assemble at examination time.
That is what M365 Guardian closes. M365 Guardian is ABT's operating model for the Microsoft 365 tenant that touches every workload (Mortgage BI in Power BI and Fabric, MortgageExchange running in Azure, Calyx PointCentral hosted in Azure), plus Microsoft 365 itself for email, Teams collaboration, and the document repositories that hold closing files. One tenant, one CSP, one security perimeter, one audit story. The credit union does not assemble compliance evidence from three platforms during NCUA examination prep; it presents a single managed-services package that examiners recognize.
The M365 Guardian operating model applies Microsoft Entra ID conditional access across all three workloads, Microsoft Defender for Office 365 across the email surface that originators and closers live in every day, Microsoft Purview audit logging across the Microsoft 365 tenant and the Azure environments where MortgageExchange and PointCentral run, and Microsoft Intune device management across the laptops loan officers carry between branches and member sites. The same governance controls examiners want to see described as a coherent operating model rather than as a list of point products.
ABT serves more than 750 financial institutions, including credit unions like Tower Federal Credit Union, Patelco Credit Union, Bay Federal Credit Union, and Chevron Federal Credit Union. As a Tier-1 Microsoft Cloud Solution Provider with SOC 2 Type II certification, ABT manages the Microsoft 365 tenant, hosts Azure workloads including MortgageExchange and Calyx PointCentral, and operates Mortgage BI as a managed analytics layer. The result is a single accountable partner across every technology surface that touches a mortgage origination at the credit union, and a single audit story across all of them.
Credit unions running their Microsoft 365 tenant under the M365 Guardian operating model gain one security and identity perimeter that extends across every workload that touches a mortgage (Power BI dashboards in Mortgage BI, Azure-hosted integrations in MortgageExchange, Azure-hosted LOS in Calyx PointCentral), plus the Microsoft 365 surface where every loan officer, processor, and closer lives. ABT applies Microsoft Entra ID conditional access, Microsoft Defender for Office 365, Microsoft Purview audit logging, and Microsoft Intune device management as a managed service so the credit union's IT team does not need deep Microsoft expertise in-house. Examiners see one accountable partner, one operating model, and one audit story across the technology stack that touches every mortgage the credit union closes.
KPIs Credit Unions Should Track to Measure Mortgage BI ROI
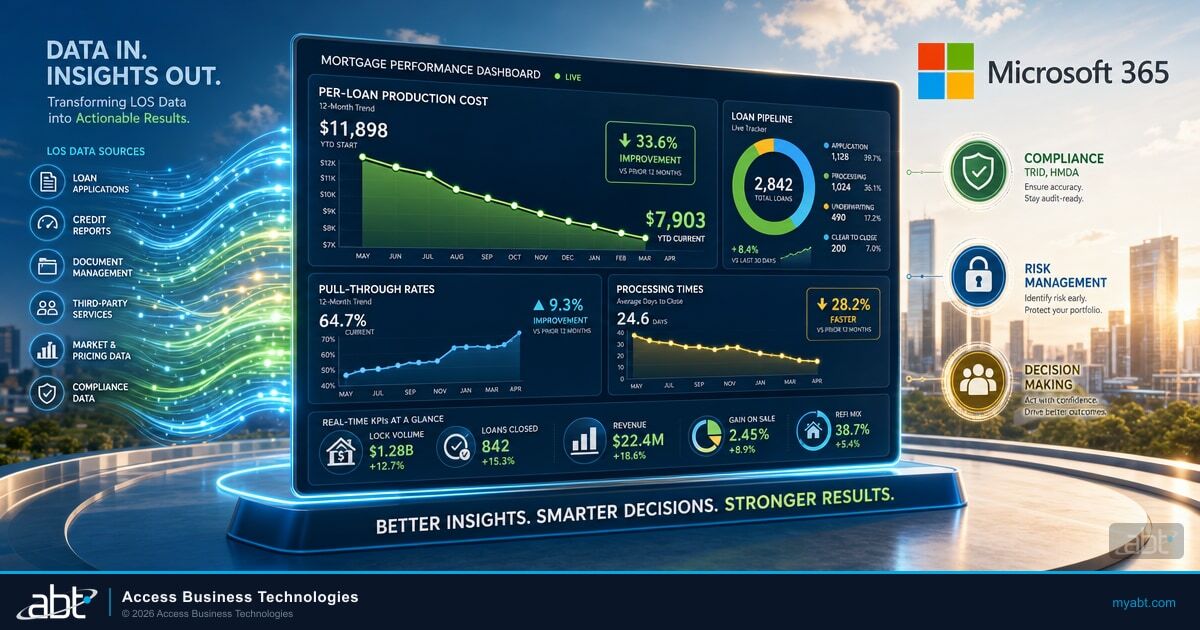
Strategies are only as useful as the dashboards that measure them. The credit unions consistently reducing per-loan cost track a specific set of metrics on a monthly cadence and review them against industry benchmarks quarterly. The list below is the Phase 2 Mortgage BI dashboard, where each metric is a tile in the cost-to-originate report pack, not an abstract goal in a budget review document.
- Fully-loaded cost per loan. Direct labor, processing fees, technology licensing across LOS, core, and servicing, compliance staff allocation, vendor management time, and exception handling. Reported daily in Mortgage BI, benchmarked against the Mortgage Bankers Performance Report quarterly. Drilldown by channel and by loan officer.
- Loans per production employee per month. Total closings divided by total production headcount including loan officers, processors, underwriters, and closers. The Mortgage BI loan officer productivity dashboard surfaces this with drillthrough to per-officer trends so management can act on structural differences rather than guessing at them.
- Average days from application to closing. Tracked separately for purchase and refinance, by loan officer where the LOS supports it. Faster closings reduce per-loan cost because they reduce the staff time each file consumes and improve member satisfaction at the same time.
- Manual data entry incidents per month. Every time staff has to retype data between systems is one of these. The Mortgage BI compliance and operational dashboard counts them weekly. Driving this number toward zero is the MortgageExchange ROI signal, and the single highest-leverage cost reduction project most credit unions can take on.
- Compliance exceptions per closed loan. Findings during post-close QC, audit, or examination that traced back to origination. Lower is better. A high or rising number signals that automated compliance checks are not catching what they should during origination and is usually a leading indicator of a MortgageExchange-eligible bottleneck.
- Member touchpoints per loan. Phone calls, emails, branch visits, and portal interactions per closed loan. Useful as a leading indicator of engagement issues and as a way to find process problems that show up as member service complaints before they show up as lost loans.
- Pull-through rate. Closed loans divided by applications. Cleaner applications and better engagement push this number up. Investments in document automation and pre-qualification accuracy show up here before they show up on the per-loan cost line.
Tracking these metrics consistently is more important than tracking them perfectly. A credit union with Mortgage BI dashboards refreshed daily and reviewed against the MBA benchmark quarterly will outperform one that perfects a flawless cost model once a year. Build the discipline first, refine the dashboards over time, and tie executive review meetings to the same numbers that line managers see on their dashboards every morning.
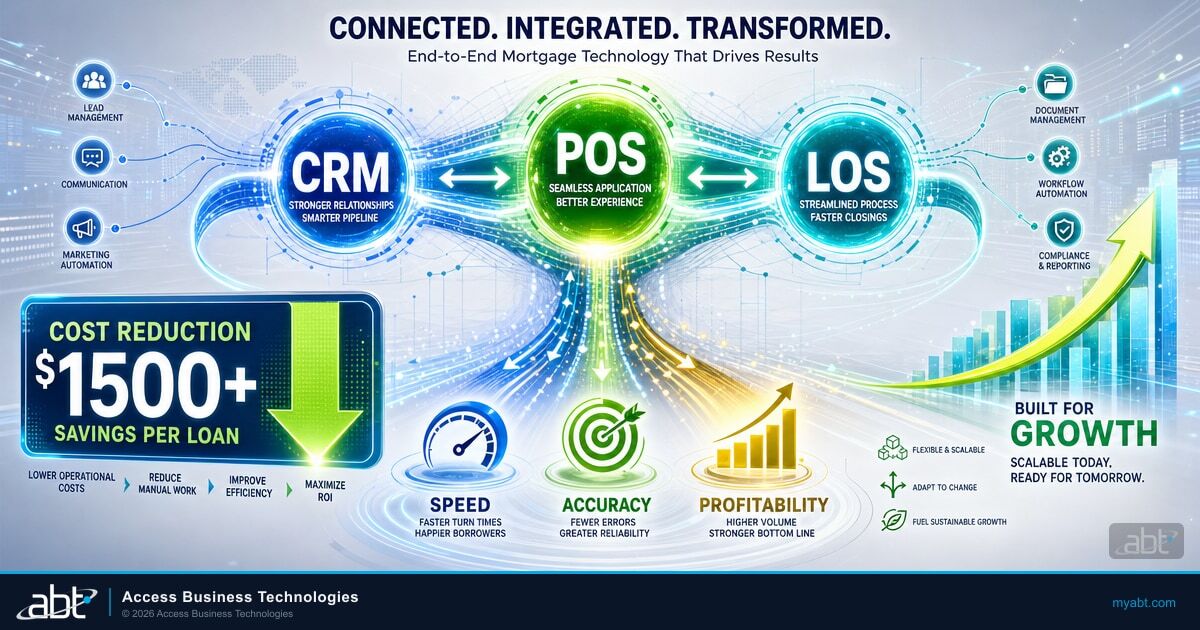
The credit unions reducing per-loan origination cost the fastest are not buying more technology. They see cost-to-originate by channel through Mortgage BI, eliminate the manual re-keying that drives the largest single bucket of avoidable cost through MortgageExchange, drop the LOS infrastructure layer onto Azure through Calyx PointCentral, and govern the whole stack through one M365 Guardian operating model with one CSP.
Stop guessing where per-loan cost is leaking
See it with Mortgage BI. Eliminate it with MortgageExchange. Drop the infrastructure cost under it with Calyx PointCentral on Azure. Govern all three with M365 Guardian and one CSP across every workload.
The Bottom Line
Reducing per-loan origination cost at a credit union is not a one-time project. It is an operating discipline built on a sequence of four product decisions that compound on each other. See it first with Mortgage BI, because every other decision depends on knowing where cost is actually leaking. Eliminate the biggest bucket with MortgageExchange, because manual re-keying is where the largest single block of avoidable per-loan cost lives at most credit unions. Drop the infrastructure cost under the LOS itself with Calyx PointCentral on Azure, because owned hardware and three-year refresh cycles are not differentiating for the credit union. Govern all three through M365 Guardian, because one operating model across the Microsoft 365 tenant that touches every workload beats three integration platforms managed separately every audit cycle.
Credit unions that adopt all four see per-loan cost trend down quarter over quarter while compliance posture and member satisfaction improve at the same time. The ones that adopt one or two see partial gains that get eaten up by the next compliance requirement or vendor renewal. The ones that bundle all four under one Tier-1 Microsoft CSP get the operating-model leverage every product was designed to deliver. That is the difference between buying technology and running a lending operation.
Frequently Asked Questions
The Mortgage Bankers Association reported that independent mortgage banks averaged $11,061 in total production expense per loan across full-year 2023, with Q4 2023 climbing to $12,485 as volume softened. Credit unions typically run below the industry average because of lower marketing spend and member loyalty that reduces acquisition costs, but the exact figure depends on loan volume, technology stack, staffing model, and how accurately the institution tracks indirect costs like compliance overhead and technology licensing.
MortgageExchange is a managed integration platform that eliminates manual re-keying between the loan origination system, the core banking platform, the servicing system, and wire instructions. Industry estimates of manual transcription error rates run 1 to 5 percent, so a credit union closing 50 mortgages a month sees six to thirty rework events monthly, each consuming staff time at roughly forty dollars per hour fully loaded. MortgageExchange removes that re-keying entirely. Bay Federal Credit Union eliminated three full-time-equivalent days of weekly post-close work using MortgageExchange. Patelco Credit Union consolidated LOS-to-core boarding, servicing handoffs, and wire instructions under a single managed integration. Tower Federal Credit Union unified five disconnected mortgage systems under one MortgageExchange operating layer.
NCUA examinations evaluate IT governance, access controls, vendor management, and business continuity for every credit union technology system including loan origination. The FFIEC IT Examination Handbook requires documented risk assessments, multi-factor authentication on all production systems, encryption of borrower data in transit and at rest, audit trails for all system access, and documented incident response procedures. The M365 Guardian operating model applies Microsoft Entra ID conditional access, Microsoft Defender for Office 365, Microsoft Purview audit logging, and Microsoft Intune device management across the Microsoft 365 tenant and the Azure environments where MortgageExchange and Calyx PointCentral run, producing the audit evidence examiners expect to see across the entire technology stack rather than only on the LOS surface.
ABT hosts each credit union's Calyx PointCentral instance in a dedicated Azure environment that ABT operates as the partner of record. The underlying architecture pairs an Azure B2s virtual machine with LRS or GRS storage depending on the credit union's disaster recovery posture, with backup retention, snapshot policy, role-based access, and Azure Monitor configured against NCUA business continuity expectations. The credit union does not buy or refresh hardware. The security posture inherits the Microsoft Azure platform controls and runs under ABT's SOC 2 Type II coverage as the partner of record. Running PointCentral on Azure-hosted infrastructure that ABT operates costs less than owned hardware on a three-year refresh cycle once the fully-loaded cost of staffing the on-prem server team is honestly counted.
The most important KPIs are fully-loaded cost per loan including direct labor and indirect expenses, loans per production employee per month, average days from application to closing, manual data entry incidents per month, compliance exceptions per closed loan, member touchpoints per loan, and pull-through rate. Tracking these metrics consistently on a monthly cadence and benchmarking against the Mortgage Bankers Performance Report quarterly produces the visibility credit union executives need to make data-driven decisions about technology, staffing, and process improvements. Mortgage BI surfaces every one of these as a dashboard tile refreshed daily from the LOS and core, with drillthrough by channel and by loan officer.
A standard LOS report shows what happened inside the LOS. Mortgage BI shows what happened across the LOS, the core banking platform, the servicing system, and the Microsoft 365 surface where loan officers and closers spend their day. Mortgage BI is a Microsoft Power BI template library and a Microsoft Fabric OneLake schema pack pre-built for the loan origination systems credit unions actually run (Encompass, Calyx PointCentral, MeridianLink, Mortgage Cadence) and the major credit union cores (Fiserv DNA, Symitar, Corelation). The headline dashboard is cost-to-originate by channel and by loan officer, refreshed daily. Credit unions already paying for Power BI through Microsoft 365 E3, E5, or Business Premium licensing ship the dashboard work in days because the data model and the report templates are already done.
ABT serves more than 750 financial institutions, including credit unions like Tower Federal Credit Union, Patelco Credit Union, Bay Federal Credit Union, and Chevron Federal Credit Union. As a Tier-1 Microsoft Cloud Solution Provider with SOC 2 Type II certification, ABT manages the Microsoft 365 tenant, operates Mortgage BI as a managed analytics layer on Power BI and Microsoft Fabric, runs MortgageExchange as a managed integration platform on Azure, and hosts Calyx PointCentral on a dedicated Azure environment per credit union. The four products run under one M365 Guardian operating model with one CSP across every workload that touches a mortgage. The combination reduces per-loan cost, simplifies NCUA examination preparation, and frees internal IT staff to focus on member-facing technology rather than vendor management.