

In This Article
- What Is Mortgage BI?
- Why Mortgage Operations Need Purpose-Built BI
- The KPIs Mortgage BI Tracks Out of the Box
- Why Mortgage BI Runs on Power BI
- How Mortgage BI Fits the ABT Ecosystem
- Building Dashboards That Drive Action
- Data Security Inside Mortgage BI
- What Regulators Expect to See
- Getting Started with Mortgage BI
- Frequently Asked Questions
Banks with mortgage divisions, credit unions running residential lending, and independent mortgage banks all generate more data than they know what to do with. Loan applications, processing times, underwriting decisions, closing costs, pull-through rates, and post-closing audit results all sit somewhere. Most of that data lives inside loan origination system reports and disconnected spreadsheets where it tells you what happened last month. Mortgage BI, built by Mortgage Workspace, turns that data into something a lending operation can act on right now.
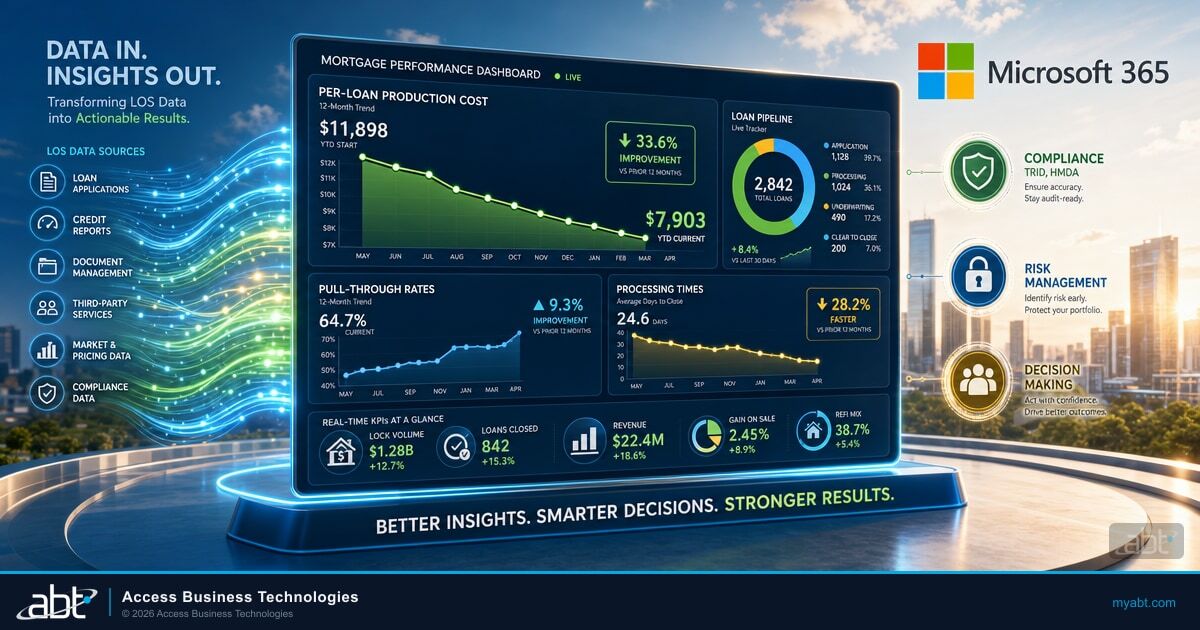
Per-loan production costs hit $11,898 in the first quarter of 2026, according to the Mortgage Bankers Association's Quarterly Mortgage Bankers Performance Report. The historical average since 2008 is $7,903 per loan. Even though 76 percent of mortgage operations posted overall profits in Q1 2026, average pre-tax production profit sat at just 16 basis points, well below the long-run average of 39 basis points. In an environment where margins are measured in basis points and examiner expectations keep growing, waiting for month-end reports to make decisions costs real money. A purpose-built business intelligence platform gives operations leaders the ability to track key performance indicators in real time and act on them before problems compound.
The gap between "we have data" and "we make better decisions" is where most mortgage lending operations stall. Mortgage BI closes that gap with pre-configured dashboards, native loan origination system connectors, and security that integrates with your existing Microsoft 365 environment. Whether you run mortgage operations inside a community bank, a credit union, or an independent mortgage bank, the platform meets you where you already license technology.
Manual Reporting
- Monthly spreadsheet exports from the loan origination system
- Stale data by the time executives or examiners see it
- Multiple conflicting versions of pipeline numbers across branches
- No automated compliance metric tracking for TRID, HMDA, or fair lending
- Individual computers hold critical reports outside any controlled environment
Mortgage BI-Powered Insights
- Live dashboards fed directly from loan origination system data
- Real-time pipeline visibility across every branch and channel
- Single version of truth for every stakeholder including auditors
- Automated TRID, HMDA, and fair lending metric tracking
- Shared platform with role-based access control inside your Microsoft 365 tenant
What Is Mortgage BI?
Mortgage BI is a business intelligence platform built by Mortgage Workspace specifically for organizations that originate mortgage loans. It runs on Microsoft Power BI and connects directly to your loan origination system, core banking system, customer relationship management platform, financial systems, and Microsoft 365 environment. Unlike generic business intelligence tools that need extensive customization for mortgage data structures, Mortgage BI ships pre-configured for the metrics and workflows mortgage operations actually use, regardless of whether those operations sit inside a bank, a credit union, or an independent mortgage bank.
The platform sits inside the broader ABT technology ecosystem alongside Mortgage Workspace's other purpose-built products: MortgageExchange for system-to-system data integration, Guardian Security Insights for threat detection, and Guardian Productivity Insights for operational efficiency tracking. Together, these tools create a closed loop where lending data flows from origination through compliance, security, and analytics without leaving a controlled, governed environment that examiners can audit.
The tagline is straightforward: from dashboards to decisions.
Why Mortgage Operations Need Purpose-Built BI
Generic business intelligence tools work. Power BI, Tableau, and QlikSense are all capable platforms. The problem is implementation. A mortgage operation using off-the-shelf Power BI still needs someone to build the data connections, design the dashboards, define the key performance indicator calculations, and configure the security model. That takes months and a data engineering team that most community banks, credit unions, and independent mortgage banks do not have on staff.
Mortgage BI eliminates that startup cost. It ships with pre-built connections to major loan origination systems including Encompass, Calyx, and Byte Software. Dashboard templates cover the key performance indicators that matter to mortgage operations. Security configurations align with Gramm-Leach-Bliley Act requirements, the FTC Safeguards Rule, and the supervisory expectations of the Office of the Comptroller of the Currency, the Federal Deposit Insurance Corporation, and the National Credit Union Administration. The gap between "we bought Power BI" and "we're making better decisions" shrinks from months to weeks.
Three things change when a mortgage lending operation moves from static reports to live dashboards.
Decisions Get Faster
A branch manager looking at a monthly origination report sees last month's numbers. A live dashboard shows today's pipeline, current lock expirations, and real-time pull-through rates. The difference between those two views is the difference between reacting to problems and preventing them.
When warehouse line costs spike, you see it in the dashboard before it hits your profit-and-loss statement. When processing times stretch beyond target, the bottleneck appears in real time instead of surfacing during the next management meeting. The same applies whether the mortgage operation reports up through a bank's chief lending officer, a credit union's vice president of lending, or an independent mortgage bank's chief operating officer.
Visibility Spans the Organization
Spreadsheet reports live on individual computers. Dashboards live on a shared platform accessible to anyone with the right permissions. Loan officers see their pipeline. Branch managers see their team's performance. Executives see organization-wide metrics. Everyone looks at the same numbers because the loan origination system feeds the dashboard directly. One version of truth. No manual data pulls, no stale exports, no conflicting spreadsheets between the production floor and the executive suite.
Compliance Becomes Measurable
Regulators across the OCC, FDIC, NCUA, and CFPB want evidence that you monitor and control your operations. Business intelligence dashboards create that evidence automatically. TRID tolerance tracking, fair lending metrics, quality control defect rates, and processing time distributions become living reports that examiners can review. The FTC Safeguards Rule, the Gramm-Leach-Bliley Act, and the Home Mortgage Disclosure Act all require demonstrable controls and reporting. The platform provides demonstrable data. For a deeper look at how business intelligence supports risk decisions across financial institutions, see our guide on business intelligence for financial institutions.

The KPIs Mortgage BI Tracks Out of the Box
Not every metric deserves a dashboard tile. The platform focuses on the key performance indicators that drive mortgage profitability and compliance, organized into four categories.
Production KPIs
Loan origination volume, pull-through rate (benchmarked at 70 to 75 percent), average days to close, pipeline velocity by stage
Financial KPIs
Cost per funded loan, net interest margin, revenue per loan officer, warehouse line utilization, basis-point profit tracking
Compliance KPIs
TRID tolerance tracking, quality control defect rates, fair lending metrics, HMDA reporting readiness
Operational KPIs
Processing touch count, condition clearing time, customer or member satisfaction scores, referral correlation
Production KPIs
- Loan Origination Volume tracks total dollar value and count of loans originated. Weekly trend views surface changes before quarterly reviews reach the board.
- Pull-Through Rate measures the percentage of locked loans that fund. The industry benchmark sits around 70 to 75 percent. Drops below 65 percent signal pricing, processing, or borrower experience problems. The dashboard flags these drops in real time.
- Average Days to Close tracks time from application to funding. Every extra day costs warehouse line interest and risks rate lock expirations.
- Pipeline Velocity shows how fast loans move through each stage. Bottlenecks at processing, underwriting, or closing become visible patterns in the dashboard rather than anecdotes at staff meetings.
Financial KPIs
- Cost Per Funded Loan combines all operational costs divided by funded loans. MBA Q1 2026 data shows the industry average at $11,898 per loan, well above the long-run historical average of $7,903. Weekly tracking catches efficiency erosion early. Our piece on maximizing profitability through mortgage business intelligence walks through how to translate cost-per-loan trends into operational changes.
- Net Interest Margin measures the spread between warehouse line cost and loan pricing. A 10-basis-point shift on a $500 million pipeline represents $500,000 annually. Daily monitoring makes that visible.
- Revenue Per Loan Officer identifies top performers and coaching opportunities. When one loan officer funds $3 million per month and another funds $800,000, the data drives the conversation. Banks, credit unions, and independent mortgage banks all apply the same metric across residential lending staff regardless of charter.
Compliance KPIs
- TRID Tolerance Tracking monitors Closing Disclosure accuracy against Loan Estimate tolerances. Zero-tolerance violations trigger mandatory cures. The dashboard flags loans approaching tolerance limits before they cross. For a deeper view of how compliance dashboards are structured, see our guide on Power BI compliance dashboards for financial institutions.
- Quality Control Defect Rates track post-closing quality control findings across documentation, calculation, and regulatory compliance categories. Trending these rates reveals systemic issues that spot checks miss.
- Fair Lending Metrics compare approval rates, pricing, and terms across demographic categories. Home Mortgage Disclosure Act data requirements make these metrics both mandatory and measurable. CFPB and prudential regulators look at fair lending data during every exam.
Operational KPIs
- Processing Touch Count measures how many times a file gets handled before funding. More touches mean more cost and more error opportunities.
- Condition Clearing Time tracks how long it takes to satisfy underwriting conditions. Slow condition clearing extends lock periods and increases costs.
- Customer or Member Satisfaction Scores from post-closing surveys correlate with referral rates and retention. Connecting these scores to production data reveals the relationship between operational speed and borrower experience. Credit unions in particular treat member experience as a strategic metric.
Why Mortgage BI Runs on Power BI
Mortgage BI is built on Microsoft Power BI for practical reasons that affect your bottom line and your security posture. Power BI is the dominant business intelligence platform across financial services, with banking, financial services, and insurance representing the largest vertical for business intelligence software adoption.
More than 90 percent of data users in banks reported that the data they need is often unavailable or takes too long to retrieve, according to Deloitte's 2026 Banking Industry Outlook. Mortgage BI solves this by connecting directly to loan origination system data and delivering pre-configured dashboards that surface the metrics your team needs without waiting for IT to build custom reports.
It's already in your license. Most banks, credit unions, and mortgage operations running Microsoft 365 Business Premium, E3, or E5 have Power BI included or available at minimal incremental cost. The platform extends what you are already paying for instead of adding another vendor to your technology stack.
It connects to your loan origination system natively. Power BI supports direct connections to Encompass, Calyx, Byte Software, and other loan origination system platforms through standard data connectors. Pre-configured connections mean live data flows from the loan origination system to the dashboard without manual exports.
It scales without infrastructure. Power BI runs in the cloud. A 50-person community bank mortgage division uses the same platform as a 500-person independent mortgage bank. Adding users, dashboards, or data sources does not require new servers.
It integrates with your security stack. Power BI honors your Microsoft 365 security policies. Conditional Access, multi-factor authentication, and data loss prevention all extend to your business intelligence content. Sensitive loan data in dashboards gets the same protection as sensitive data in email.
Row-level security controls access. Branch managers see their branch. Regional directors see their region. Executives see everything. The same dashboard serves every audience without building separate reports. For banks with mortgage divisions, row-level security separates residential lending data from commercial lending data without parallel deployments.

How Mortgage BI Fits the ABT Ecosystem
The platform does not exist in isolation. It is the analytics layer in a purpose-built technology stack that ABT has developed over 25-plus years serving 750-plus financial institutions including community banks, credit unions, and independent mortgage banks.
M365 Guardian secures your Microsoft 365 tenant with Conditional Access, DLP, and device compliance
MortgageExchange integrates the loan origination system, core banking, and financial systems
Mortgage BI delivers real-time dashboards from your connected data
AI summaries and exception alerts drive daily operational decisions
M365 Guardian provides the foundation. Before your data reaches the business intelligence layer, M365 Guardian hardens your Microsoft 365 environment. Conditional Access policies, Microsoft Intune device compliance, email authentication, and Microsoft Purview data loss prevention rules create a controlled environment where data integrity starts at the tenant level. Examiners reviewing your Information Security Examination evidence appreciate when those controls produce auditable artifacts.
MortgageExchange feeds the data. MortgageExchange handles the extract, transform, and load work between your loan origination system, core banking system, and other data sources. Clean, consistent data flows into your dashboards because MortgageExchange standardizes it upstream. For banks running both consumer and commercial lending alongside mortgage, MortgageExchange is the integration tier that keeps the mortgage analytics layer clean.
Guardian Insights add context. Security Insights and Productivity Insights data appears inside your dashboards, giving you a unified view that connects operational performance to security posture. You can see, in one place, whether a spike in processing time correlates with a system issue, a security event, or a staffing gap.
AI adds interpretation. The platform includes an AI layer that summarizes complex datasets, detects patterns, and recommends action. Instead of a chart that shows pull-through rates dropped 8 percent this week, you get a plain-language summary identifying which loan officers, branches, or product types drove the change and what to do about it.
Building Dashboards That Drive Action
The difference between a useful dashboard and a wall of charts is whether it drives someone to do something different. The platform follows three design principles that keep dashboards actionable.
Lead with Exceptions
Nobody needs a dashboard to tell them things are normal. Effective dashboards highlight what is outside tolerance. Loans past their expected close date. Lock expirations within 48 hours. Processing queues exceeding capacity. Compliance metrics approaching thresholds. Design for the exception, not the average.
Connect Metrics to Decisions
Every dashboard tile answers a question that leads to an action. "What's our pull-through rate?" leads to "Which locked loans are at risk of falling out?" leads to "Who needs to call which borrower today?" If a metric does not connect to a decision, it does not belong on the primary dashboard. The same discipline applies whether the dashboard serves a credit union member-facing team or an independent mortgage bank operations floor.
Refresh Frequently
A dashboard showing yesterday's data is a report with a fancy interface. Refresh intervals should match your decision cadence. Pipeline data refreshes hourly or in real time. Financial metrics refresh daily. Compliance aggregates refresh weekly. The refresh rate matches the speed at which the metric changes and the speed at which you need to respond.
Data Security Inside Mortgage BI
Mortgage dashboards display sensitive financial data. Social Security numbers, income verification, credit scores, and loan amounts flow through the business intelligence platform. The security model addresses this with four layers, all integrated with your existing Microsoft 365 policies.
| Security Layer | What It Does | Regulatory Alignment |
|---|---|---|
| Authentication (multi-factor authentication) | Enforces multi-factor authentication for every dashboard user via Microsoft Entra ID | FTC Safeguards Rule, GLBA, NCUA 12 CFR 748 |
| Authorization (row-level security) | Row-level security limits data access by role and location | GLBA, state privacy laws, NCUA member-information safeguards |
| Data Loss Prevention | Microsoft Purview DLP policies and sensitivity labels extend to business intelligence exports | FTC Safeguards Rule, CFPB, FFIEC IT Examination Handbook |
| Audit Trails | Microsoft Purview Audit logs every dashboard view, export, and data access event | GLBA, FTC Safeguards Rule, NCUA 72-hour cyber incident reporting |
Authentication: Multi-factor authentication enforcement for every user accessing the dashboards. No exceptions for "it's just reports." Dashboards containing borrower data deserve the same authentication as the loan origination system itself. Microsoft Entra ID Conditional Access policies extend to the business intelligence layer without separate configuration.
Authorization: Row-level security and workspace-level permissions ensure users see only the data they need. A loan officer in Denver should not see individual loan details from the Phoenix branch. A community bank's mortgage division should not see commercial lending data unless the same person holds both roles.
Data Loss Prevention: Microsoft Purview data loss prevention policies extend to the business intelligence layer. Sensitivity labels applied to datasets flow through to dashboards and exports. This prevents sensitive data from leaving your controlled environment through PDF exports or screen captures.
Audit Trails: Every dashboard view, report export, and data access event generates an audit log inside Microsoft Purview Audit. When examiners ask who accessed what data and when, the answer exists before the question is asked. For credit unions, the 72-hour cyber incident reporting rule introduced by the NCUA in February 2023 makes audit-trail completeness a regulatory requirement rather than a nice-to-have.
What Regulators Expect to See
Mortgage lending operations sit under multiple regulatory bodies depending on the charter. Banks answer to the OCC or FDIC, with mortgage activities reviewed against the FFIEC IT Examination Handbook. Credit unions answer to the NCUA through the Information Security Examination program. Independent mortgage banks answer to state regulators and the CFPB. All of them increasingly expect demonstrable, data-backed evidence of operational controls.
The NCUA's 2026 Supervisory Priorities highlight an eight-element risk assessment framework: risk appetite, information assets, systems, risks, controls and testing, measurement, treatment, and reporting. Business intelligence dashboards directly support every element of that framework with measurable, exportable evidence. The Information Security Examination program reviews how credit unions identify, measure, monitor, and control technology-related risks. Live dashboards demonstrate exactly that.
For banks, the FFIEC IT Examination Handbook expects management to maintain monitoring and reporting that supports timely identification of operational and compliance issues. Static monthly reports satisfy the letter of that expectation. Live dashboards satisfy the spirit. When an examiner asks how the institution monitors pull-through rates against pricing or fair lending metrics across protected classes, a working dashboard reflects ongoing oversight in a way that a quarterly PDF cannot.
For independent mortgage banks, state mortgage regulators and the CFPB look at fair lending and TRID compliance during every exam cycle. The MBA's 2026 outlook notes that containing origination costs and increasing efficiencies will remain the differentiator between profitable and unprofitable companies. Dashboards covering TRID tolerance, quality control defect rates, and HMDA data readiness give compliance teams the same real-time visibility that operations teams get over pipeline.
Getting Started with Mortgage BI
You do not need a data engineering team to get started. Pre-built templates and loan origination system connectors mean deployment follows a clear path.
The question for banks, credit unions, and independent mortgage banks is not whether mortgage operations need business intelligence, but how quickly the operation can get from raw loan origination system data to decisions that protect margin and satisfy examiners.
ABT Mortgage Technology Ecosystem perspective, 2026
Start with one dashboard. Pick the metric your executives or board ask about most often. For most mortgage operations, that is daily lock volume and pipeline status. The platform has a template for exactly this. Prove the value before expanding scope.
Connect to your loan origination system first. Your loan origination system contains 80 percent of the data you need for production and compliance dashboards. Pre-configured connectors for Encompass, Calyx, and Byte Software get data flowing in days, not months.
Use the pre-built templates. The platform ships with dashboard templates designed for mortgage operations. Production dashboards, compliance dashboards, financial performance views, and branch comparison reports are ready to customize with your data. You are adapting proven designs, not starting from a blank canvas.
Train power users, not everyone. Identify two or three people in operations who will build and maintain custom dashboards. Everyone else consumes the output. This keeps the investment manageable while delivering value across the organization.
Expand into the ecosystem. Once the dashboards are running, layer in MortgageExchange for deeper data integration and Guardian Insights for security and productivity metrics. Each addition enriches what you can see and act on.
Key Takeaway
ABT deploys and manages Mortgage BI as part of a broader managed IT relationship. As a cloud-first managed service provider and a Tier 1 Microsoft Cloud Solution Provider primarily dedicated to financial services, ABT handles the Power BI deployment, security configuration, loan origination system connectivity, and ongoing maintenance for banks, credit unions, and independent mortgage banks. Your team focuses on building the dashboards that drive decisions while ABT manages the Microsoft 365 tenant underneath.
The same Conditional Access policies, Microsoft Intune device compliance, and Microsoft Purview data loss prevention rules that protect your email and SharePoint data extend to your business intelligence dashboards. A managed service provider already managing your Microsoft 365 security deploys the platform within that existing security framework instead of creating a separate, potentially inconsistent, security layer that examiners would question.
That closed-loop architecture is the real value proposition. Your environment is hardened by M365 Guardian. Your systems are connected by MortgageExchange. Your data is analyzed by Mortgage BI. Your Microsoft 365 tenant is managed by ABT. One partner, one stack, one relationship. That works for credit unions, community banks, and independent mortgage banks alike.
Ready to Turn Your Loan Origination Data into Decisions?
A Mortgage BI consultation with ABT includes:
- Loan origination system connectivity assessment for Encompass, Calyx, or Byte Software
- Dashboard template review matched to your key performance indicator priorities
- Security configuration plan aligned with GLBA, the FTC Safeguards Rule, and your prudential regulator
- Return on investment estimate based on your current reporting costs and loan volume
Frequently Asked Questions
Mortgage BI is a purpose-built business intelligence platform from Mortgage Workspace running on Microsoft Power BI. Unlike generic deployments, it ships with pre-configured loan origination system connectors for Encompass, Calyx, and Byte Software, plus dashboard templates for mortgage-specific key performance indicators like pull-through rate, TRID tolerance, and cost per funded loan. It eliminates months of custom development for banks, credit unions, and independent mortgage banks alike.
Mortgage BI tracks key performance indicators across four categories: production metrics like loan origination volume, pull-through rate benchmarked against the 70 to 75 percent industry average, and pipeline velocity; financial metrics including cost per funded loan, net interest margin, and revenue per loan officer; compliance metrics covering TRID tolerance tracking, HMDA reporting readiness, and quality control defect rates; and operational metrics like processing touch count and condition clearing time.
Mortgage BI secures borrower data through four layers integrated with Microsoft 365: multi-factor authentication enforcement via Microsoft Entra ID, row-level security and workspace permissions for authorization, Microsoft Purview data loss prevention policies with sensitivity labels extending to exports, and comprehensive audit trails in Microsoft Purview Audit logging every access event. These controls align with the FTC Safeguards Rule, the Gramm-Leach-Bliley Act, FFIEC IT Examination Handbook expectations, and the NCUA 72-hour cyber incident reporting rule for credit unions.
Yes. Mortgage BI includes pre-configured connectors for major loan origination systems including Encompass, Calyx, and Byte Software. Live data flows from the loan origination system to dashboards without manual exports. For deeper integration, MortgageExchange handles extract, transform, and load processing between the loan origination system, core banking systems, and other data sources, feeding clean and standardized data into Mortgage BI automatically.
Yes. Mortgage BI is designed for banks, credit unions, and independent mortgage banks that do not have dedicated data engineering staff. Pre-built dashboard templates and pre-configured loan origination system connectors reduce deployment from months to weeks. ABT manages the technical deployment as part of its managed IT relationship. Training two or three power users in operations to customize dashboards while everyone else consumes the output keeps the investment manageable.
Mortgage BI produces measurable, exportable evidence for the operational and compliance areas examiners review. For credit unions, the NCUA Information Security Examination program and the 2026 eight-element risk assessment framework both look for evidence of monitoring, control testing, and reporting, all of which dashboards can provide. For banks, the FFIEC IT Examination Handbook expects management monitoring that supports timely identification of issues, which is exactly what live dashboards demonstrate. For independent mortgage banks, dashboards covering TRID, HMDA, and fair lending metrics give compliance teams the same visibility operations teams use over pipeline.