

In This Article
- Why Most Financial Institutions Drown in Data and Starve for Insight
- What Business Intelligence Actually Delivers for Lenders
- The Microsoft BI Stack for Financial Institutions in 2026
- A Five-Phase BI Rollout for Banks, Credit Unions, and Mortgage Companies
- Governance, Security, and Examiner Readiness
- Common BI Mistakes Financial Institutions Make
- Technical Reference
- Frequently Asked Questions
A typical mortgage company in 2026 runs eight to fifteen software systems against every loan. A community bank or credit union runs a similar count against every member relationship. Each system captures a slice of the picture. None of them captures the whole. The result is a financial institution that has every fact it could possibly want and almost no way to assemble those facts into a decision before the moment for the decision has passed.
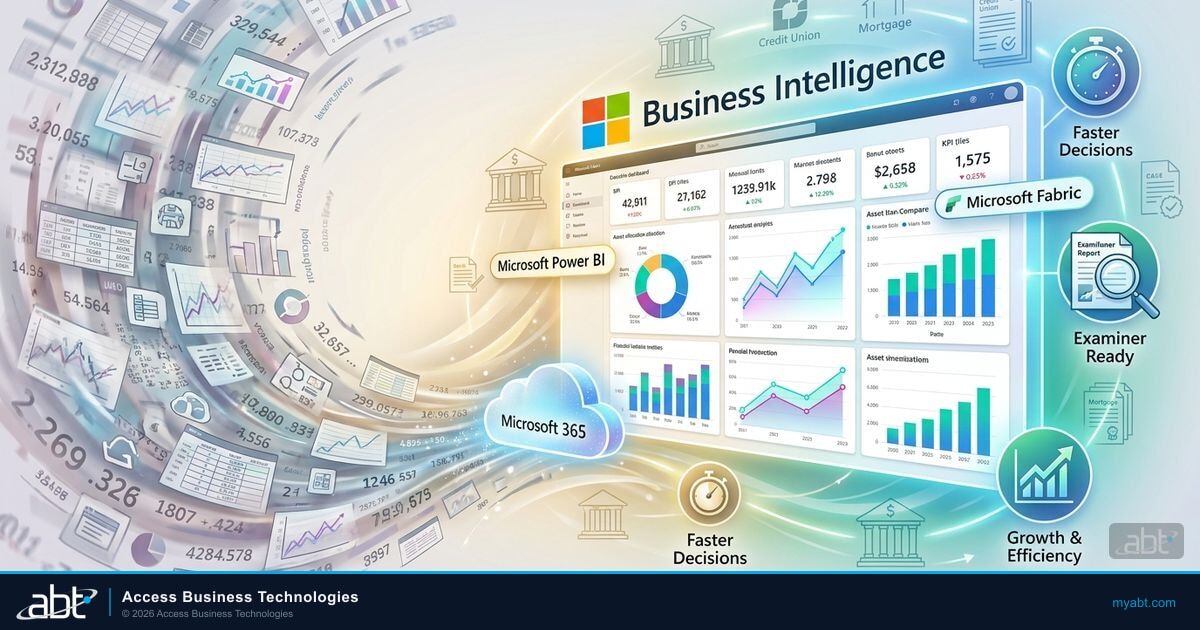
Business intelligence is the practice of unifying that scattered data into a single view where a CFO, a credit officer, or a branch manager can see what is happening across the institution and act on it in hours rather than weeks. The technology is mature. Microsoft Power BI is the dominant tool. Microsoft Fabric, the unified analytics platform underneath it, passed 31,000 paying customer organizations in March 2026 and is the fastest-growing data platform in Microsoft's history. The question is no longer whether to build a BI practice. The question is how to build one that pays back within a quarter and stays examiner-ready as it scales.
This guide walks through what BI delivers for banks, credit unions, and mortgage companies, the Microsoft stack that sits underneath a modern BI program in 2026, a five-phase rollout that produces value fast, and the governance discipline that keeps the program defensible when regulators arrive. It is written for CFOs, COOs, IT directors, and credit officers who already run Microsoft 365 and want to understand what a connected data platform on top of it actually looks like.
Why Most Financial Institutions Drown in Data and Starve for Insight
The data fragmentation problem in financial services is structural, not behavioral. A single mortgage loan touches the loan origination system, the customer relationship management platform, the pricing engine, the document repository, the compliance audit log, the disclosure delivery service, the appraisal management company, the title vendor, and the investor delivery platform. A single deposit relationship at a bank or credit union spans the core processing system, the digital banking platform, the card network, the BSA/AML monitoring tool, and the marketing automation system. Each system captures part of the truth. No system captures all of it.
Ask a question that requires data from three systems and most institutions cannot answer it without days of manual spreadsheet work. What is our cost to originate by lead source? Which member segments produce the highest non-interest income? Are our HMDA fields complete across the pipeline before year-end submission? Which loans have rate locks expiring in the next fourteen days and which of those are at risk of missing the deadline? These are not exotic questions. They are the questions a competent executive committee asks every week. Without business intelligence, the answers arrive late, arrive inconsistent, or do not arrive at all.
The cost of that gap shows up in three places. Pricing decisions are made on intuition because the cost data sits behind multiple system extracts that nobody has time to reconcile. Bottlenecks are diagnosed weeks after they form because the indicators that would have caught them lived in a system the manager could not see. Examination findings concentrate around data accuracy because the institution cannot prove that the numbers in its regulatory reports came from the same source as the numbers in its operational dashboards. For ABT's fuller take, see Breaking the Mortgage Data Bottleneck.
Why This Matters for Banks, Credit Unions, and Mortgage Companies
The FFIEC IT Examination Handbook and OCC Bulletin 2023-17, the interagency guidance on third-party risk management, both presume that an institution can produce coherent, repeatable data on demand. Examiners no longer accept screen captures, manually assembled spreadsheets, or one-off Excel files as evidence of operational control. They expect a connected reporting environment where the source of every number is documented, the refresh schedule is known, and access is governed. A BI practice built on Microsoft Power BI and Microsoft Fabric produces that evidence as a byproduct of normal operations rather than as a separate compliance project.
What Business Intelligence Actually Delivers for Lenders
Business intelligence is not prettier charts. It is a faster decision loop. The institutions that get value from BI use it to compress the time between something happening in the business and somebody acting on it. Four capabilities define that compression.
1. Unified Pipeline and Portfolio Visibility
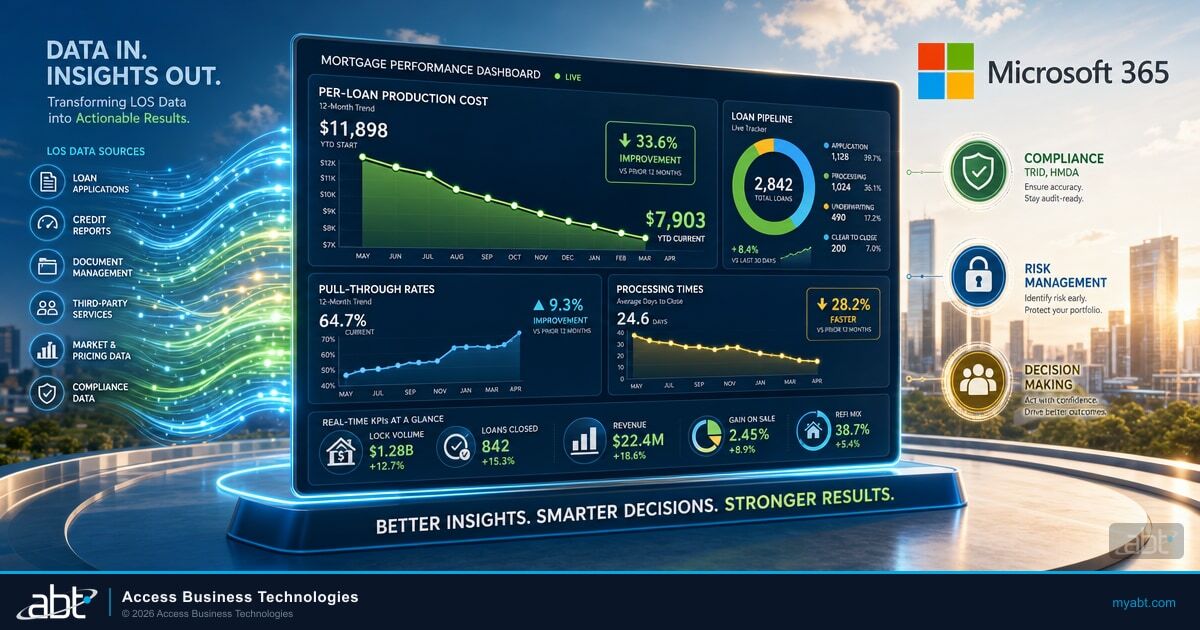
A Power BI dashboard connected to the loan origination system, the CRM, the pricing engine, and the core banking platform shows the institution's pipeline and portfolio in one view. A branch manager can filter to her branch in two clicks. A credit officer can drill from a portfolio-level concentration view down to the specific loans driving the concentration. A CFO can see daily funding volume against monthly target without waiting for the month-end production report. The dashboard refreshes on a schedule the institution sets, ranging from once per day for slow-moving metrics to every fifteen minutes for time-sensitive ones such as lock expiration exposure.
2. Leading Indicators Instead of Trailing Reports
Static reports describe what already happened. Dashboards calculate forward-looking metrics that change behavior. Days-in-stage trending shows whether processing is slowing this month versus last, in time to redirect resources before the slowdown becomes a closing delay. Lock expiration exposure shows how many loans have locks expiring inside fourteen days, ranked by risk of missing the deadline. Condition clearance velocity tells the operations leader whether her team is gaining or losing ground on underwriting queue. Application-to-closing conversion by lead source separates the marketing channels that produce funded loans from the ones that produce abandoned applications.
- Days-in-stage trending catches processing slowdowns before they become closing delays.
- Lock expiration exposure ranks every locked loan by remaining days, surfacing the at-risk ones for proactive outreach.
- Condition clearance velocity measures how fast underwriting is closing conditions, week over week.
- Application-to-closing conversion by lead source connects marketing spend to funded production rather than to raw applications.
- Pull-through rate by loan officer and branch identifies who is producing closed loans versus who is producing applications that die in processing.
3. Compliance and Examiner-Ready Reporting
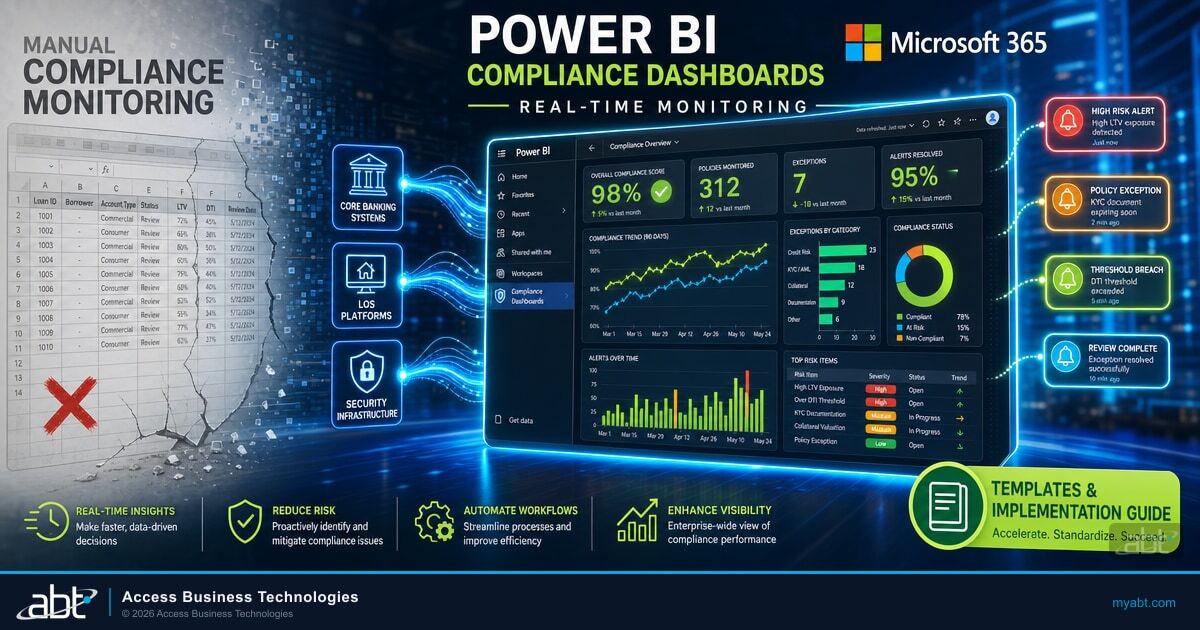
Regulators expect continuous monitoring rather than year-end scrambles. A Power BI compliance workspace monitors HMDA data fields across the pipeline in real time, flagging incomplete or inconsistent records before submission deadlines. It tracks Loan Estimate and Closing Disclosure delivery dates against TILA-RESPA thresholds, identifying loans approaching tolerance violations before they occur. Fair lending dashboards visualize approval rates, pricing, and terms across demographic groups so the compliance officer can review concentrations before an examiner does. Third-party service-level dashboards track appraisal turn times, title turnaround, and vendor performance against contractual obligations, which is the form the FFIEC IT Examination Handbook expects to see for third-party oversight.
4. Cost, Profitability, and Capital Allocation Analysis
Mortgage profitability depends on dozens of variables that traditional reporting cannot analyze together. BI separates cost to originate by loan product, by branch, and by loan officer. It calculates revenue per loan including servicing release premiums, origination fees, and gain-on-sale. It connects marketing campaign spend to closed loan volume by lead source. It allocates overhead by department and branch so the executive committee can see where margin is being earned and where it is being given away. For banks and credit unions, the equivalent analysis covers non-interest income by product, profitability by member segment, branch performance against deposit and lending targets, and capital ratios against internal limits.
A regional mortgage lender originates 280 loans per month. Forty-five of those loans have rate locks expiring within fourteen days at any given time. Without a BI dashboard, the pipeline manager pulls a weekly extract on Friday afternoon, identifies the at-risk loans Monday morning, and contacts the underwriting team Tuesday. By Wednesday, twelve of those loans have already missed the lock deadline.
The same lender runs a Power BI dashboard refreshing every fifteen minutes against the loan origination system. The dashboard surfaces the forty-five at-risk loans with a single ranked view, color-coded by remaining days and underwriting status. The pipeline manager reviews it every morning at 8:00 a.m. and routes specific files to specific underwriters by 8:15. Lock-deadline miss rate drops from 4.3 percent to under 1 percent within two months, recovering an average of $2,100 per saved loan in lock extension fees and price concessions.
The Microsoft BI Stack for Financial Institutions in 2026
For institutions already on Microsoft 365, the Microsoft BI stack is the most defensible choice in 2026. It integrates with Microsoft Entra ID for authentication, applies Microsoft Purview policies to BI datasets automatically, and runs on Microsoft Azure infrastructure with the security posture financial services examiners already know how to evaluate. Four products sit at the core. Our guide to Microsoft 365 Copilot Business Pricing for Community Banks, Credit Union goes deeper on this.
- Microsoft Power BI
- The visualization, dashboarding, and self-service analytics layer. Power BI Pro licenses cost $14 per user per month as of April 1, 2025, and remain the standard rate in 2026. Power BI Premium Per User adds dataset size and refresh frequency capabilities at $24 per user per month.
- Microsoft Fabric
- The unified analytics platform that combines data engineering, data warehousing, real-time analytics, business intelligence, and AI workloads on a shared foundation called OneLake. Fabric passed 31,000 paying customer organizations in March 2026, making it the fastest-growing data platform in Microsoft's history.
- OneLake
- The unified logical data lake built on Azure Data Lake Storage that comes automatically with every Microsoft Fabric tenant. OneLake stores every analytical dataset once and lets every Fabric workload read it without copying data, eliminating the duplication and reconciliation problems that plague traditional data warehouses.
- Microsoft Purview
- The governance and compliance layer that applies sensitivity labels, retention policies, and audit logging to BI datasets automatically. Purview makes BI workloads inherit the same data governance posture an institution already operates against Exchange, SharePoint, and OneDrive.
- Row-Level Security (RLS)
- A Power BI feature that restricts data access based on user identity. Branch managers see only their branch's loans, loan officers see only their own pipeline, and executives see the full company view from the same underlying dashboard.
Power BI does most of the visible work. A loan officer opens a dashboard in the Power BI mobile app to check her pipeline before a borrower call. A CFO opens an embedded report inside Microsoft Teams to check yesterday's funding volume during a stand-up. A branch manager opens a SharePoint page that hosts an embedded Power BI report and sees her branch's compliance status, pipeline aging, and funding pace in one view.
Underneath that visible layer, Microsoft Fabric and OneLake do the heavy lifting that prevents the dashboard from becoming yet another disconnected report. Data from the loan origination system, the CRM, the core banking platform, and the compliance audit log lands in OneLake once. Every downstream workload, including Power BI dashboards, machine learning models, and ad-hoc analytics, reads from that one source. Numbers across reports match because they come from the same place. A regulator who asks where the figure in the year-end HMDA submission came from can trace it back to the OneLake table that produced it.
Across the 750-plus financial institutions ABT manages on Microsoft 365, the most common BI rollout failure pattern is not tool selection. It is treating Power BI as a reporting product instead of as the visible layer of a Microsoft Fabric and OneLake data platform. Institutions that build one dashboard at a time against direct LOS extracts produce a portfolio of reports that disagree with each other, refresh on different schedules, and require manual reconciliation every month. Institutions that land their data in OneLake first, then build Power BI on top, ship dashboards in days rather than weeks, get matching numbers across every report by construction, and inherit Microsoft Purview governance automatically. ABT's Mortgage BI is a Power BI template library and OneLake schema pack pre-built for ICE Encompass, Calyx PointCentral, and the major core banking platforms, pre-built and pre-governed so financial institutions ship Phase 2 in days rather than weeks. ABT layers M365 Guardian, the firm's FI-tuned operating model for these Microsoft tools, on top of the Fabric and Power BI deployment so the Sentinel detection rules, Purview policies, and 24/7 SOC monitoring travel with the BI platform. The Microsoft 365 license bundle most financial institutions already own includes Power BI Pro entitlements and Fabric trial capacity. The fixes are sequencing decisions, not procurement decisions.

Want a Microsoft Fabric and Power BI roadmap built for your loan origination, CRM, and core banking stack? Talk to an ABT expert about a Mortgage BI implementation plan tailored to your systems.
A Five-Phase BI Rollout for Banks, Credit Unions, and Mortgage Companies
The institutions that get the fastest payback from BI do not try to boil the ocean. They land one high-value dashboard, prove the concept, and expand on a known schedule. Five phases describe the path from zero to a mature BI practice.
Phase 1: Foundation in OneLake
The first phase is unglamorous and unavoidable. Stand up a Microsoft Fabric workspace, configure OneLake, and land the loan origination system data and the core banking platform data into OneLake tables. This is the foundation every later phase reads from. Skipping it produces the report sprawl problem the partner insight described above. The Phase 1 deliverable is not a dashboard. It is an OneLake foundation where the data refreshes on a known schedule, the column types are documented, and access is controlled through Microsoft Entra ID groups.
Phase 2: Pipeline or Portfolio Dashboard
The second phase produces the first visible dashboard. For mortgage companies, that is the pipeline health dashboard showing volume by status, days-in-stage trending, pull-through rate by loan officer and branch, lock expiration exposure, and funding volume against target. For banks and credit unions, it is the portfolio health dashboard showing concentration by sector, delinquency trending, deposit run-off by segment, and lending capacity against capital limits. Five metrics is the right starting point. More than that dilutes attention. Less than that does not justify the build cost. The dashboard ships in two to four weeks once the OneLake foundation is in place.
Phase 3: CRM and Full-Funnel Visibility
The third phase connects the customer relationship management platform to the same OneLake foundation. This is the phase where marketing ROI becomes calculable for the first time at most institutions. Cost per funded loan by lead source. Member acquisition cost by channel. Branch-level new account opening velocity against marketing spend. Pipeline leakage reporting that shows where leads enter the CRM but never become applications, and where applications enter the LOS but never reach closing.
Phase 4: Compliance and Examiner-Ready Reporting
The fourth phase brings compliance data into OneLake. HMDA fields, disclosure delivery timing, fair lending data, BSA/AML alert history, vendor performance against service-level agreements. The compliance dashboards that emerge here are the ones examiners ask about. The discipline is to build them for compliance officers first and to treat the examiner-facing view as a derivative of the operational view. Compliance dashboards that exist only for examiners decay between examinations. Compliance dashboards that compliance officers use every week stay current by definition.
Phase 5: Predictive Analytics and Copilot for Power BI
The fifth phase layers AI on top of the foundation the first four phases built. Power BI's built-in AI visuals identify trends and anomalies that human analysts would miss. Copilot for Power BI lets the CFO ask a question in natural language ("Show me funded loan volume by branch for the last 90 days, with year-over-year change") and get a chart and a narrative back in seconds. Microsoft Fabric's machine learning capabilities support more advanced workloads such as borrower-level risk scoring, deposit run-off prediction, and loan officer performance forecasting. None of this works without the prior four phases, which is why most institutions that try to start with Phase 5 produce demos that do not survive contact with examiners or operating leaders.
Microsoft Fabric workspace configured, LOS or core banking data landing on a known schedule, Microsoft Entra ID access groups defined.
Five-metric starting dashboard published to a named audience with a refresh schedule and an owner who reviews it daily.
Marketing spend tied to closed production by source, lead-to-funded conversion by channel visible to the executive committee.
HMDA, disclosure timing, fair lending, and vendor performance reporting reviewed weekly by compliance officers and accessible on demand to examiners.
Sensitivity labels on BI datasets, retention policies inherited from M365, audit log capturing every report access and export.
Natural language reporting, AI-assisted dashboard creation, and Microsoft Fabric machine learning models for risk scoring or forecasting.
A CFO who can answer "Where is my margin?" in thirty seconds runs a different institution from one who waits for the month-end production report. That gap is the BI investment thesis.
Governance, Security, and Examiner Readiness
A BI program that produces faster decisions also produces faster ways to leak data, generate inconsistent numbers, and surprise examiners. Three governance disciplines keep the program defensible.
Access Governance Through Microsoft Entra ID and Row-Level Security
Power BI inherits authentication from Microsoft Entra ID, which means every dashboard view runs under the user's identity rather than a shared service account. Row-Level Security extends that identity into the data itself. A branch manager opens the institution-wide pipeline dashboard and sees only her branch's loans. A loan officer opens the same dashboard and sees only her own pipeline. A regional president sees every branch in her region. The data lives in one OneLake table. The filter is applied at query time based on identity. This is how multi-tenant analytics work without producing multiple copies of the data, and it is the configuration that compliance officers and examiners expect to see. We cover How Loan Officers, Processors, and Underwriters Use Microsoft 365 Copilo in a companion piece.
Data Governance Through Microsoft Purview
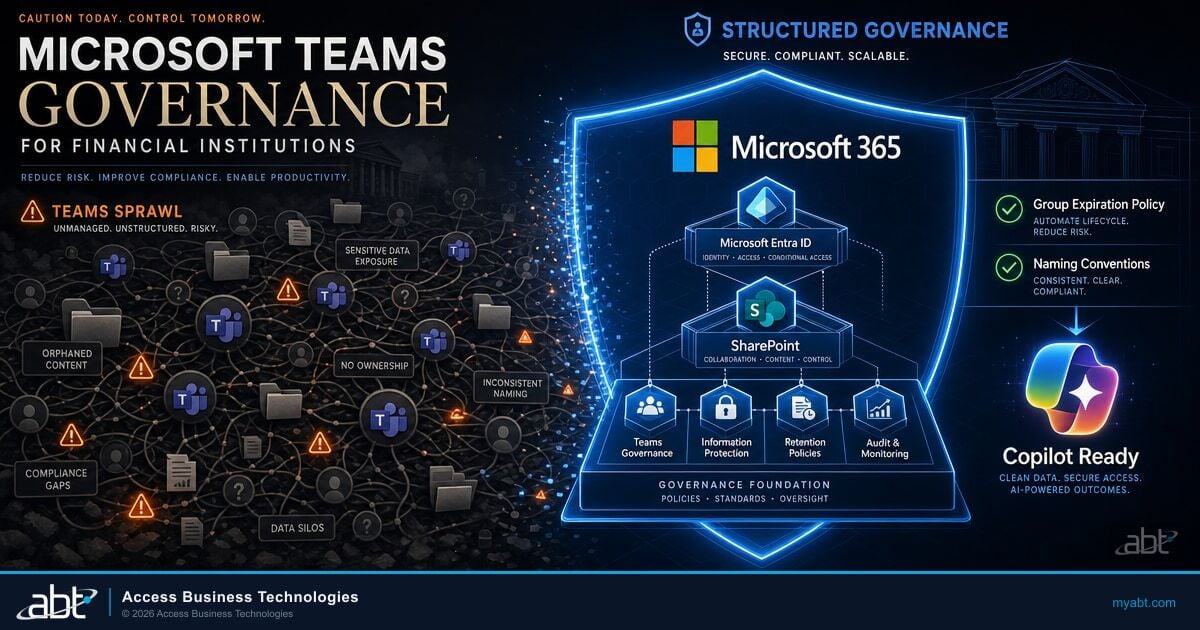
Microsoft Purview applies sensitivity labels, retention policies, and audit logging to every BI dataset the institution touches. A dashboard built on top of a OneLake table that contains member personally identifiable information inherits the sensitivity label from the underlying table. Exports of that dashboard carry the label with them. A loan officer who emails a Power BI export to a personal address triggers a DLP alert. The compliance officer who reviews the alert sees who accessed the dashboard, when, and what was exported. None of that requires custom development. It is the configuration of a Purview policy applied to the BI workspace.
The Failure Mode That Examiners Catch
Power BI deployments that bypass Microsoft Purview produce a dashboard portfolio that has no inherited governance. Exports flow to personal email without DLP intervention. Sensitivity labels do not propagate to downloaded files. Retention policies do not apply to the underlying data extracts. An examiner who asks "What data does this dashboard contain, who can access it, and how long is it retained?" gets answers the institution has to assemble manually. A correctly configured Purview-governed Power BI workspace answers those questions by design.
Examiner-Ready Lineage and Reporting
The discipline that separates a BI program that survives an examination from one that does not is data lineage. Every number on every dashboard must trace back to the OneLake table that produced it, the source system that fed that table, and the refresh schedule that keeps it current. Microsoft Fabric documents this lineage automatically through its data catalog. A regulator who asks where the figure in the year-end HMDA submission came from can be shown the OneLake table, the LOS extract that fed it, and the audit log of every transformation along the way. Institutions that build dashboards without that lineage discipline produce reports that examiners cannot trust, which makes the program a liability rather than an asset.
Common BI Mistakes Financial Institutions Make
Five patterns stall BI initiatives before they deliver value. All five are avoidable if the program is designed with them in mind.
Building Too Many Dashboards at Once
Start with one dashboard. Get it right. Get people using it daily. Then build the next one. Launching five dashboards simultaneously means none of them get the attention they need to validate data accuracy and tune visualizations to what users actually need. A portfolio of half-finished dashboards is worse than a single complete one because it teaches the organization that BI produces numbers it cannot trust.
Ignoring Data Quality at the Source
BI dashboards amplify data quality problems. If loan officers enter inconsistent product codes in the LOS, the cost-to-originate dashboard will reflect that inconsistency. The fix is field validation and required-field configuration in the source system, not transformation logic in OneLake. Data quality work that lives downstream of the source produces a maintenance burden that grows linearly with dashboard count.
Treating BI as a Reporting Project Instead of a Platform
A reporting project produces a report. A platform produces every report the institution will ever need. The OneLake foundation is the platform. Power BI is the visible layer on top of it. Institutions that skip the OneLake foundation produce a series of reporting projects that disagree with each other and require manual reconciliation every month. The first phase looks slow because the deliverable is invisible. Every subsequent phase ships in a fraction of the time because the foundation does the heavy lifting.
No Named Audience and No Specific Decision
Every dashboard should have a named audience and a specific decision it supports. "Pipeline overview" is too vague. "Branch manager weekly pipeline action list, surfacing loans at risk of lock expiration or closing delay, reviewed every Monday at 9:00 a.m." tells you exactly who uses the dashboard, when, and what they do with the information. The dashboards that survive in production are the ones with that level of specificity. The dashboards that decay are the ones built for nobody in particular.
No Governance Until the Examiner Asks
Microsoft Purview, Row-Level Security, and Microsoft Entra ID-backed access groups are not optional features to apply later. They are the configuration the program runs on from day one. Institutions that defer governance produce a BI environment they have to retroactively secure, which costs more than getting it right from the start and produces gaps that examiners find first.
Microsoft Power BI on top of Microsoft Fabric and OneLake, governed by Microsoft Purview, is the strongest BI architecture for financial institutions in 2026. It compresses decision time from weeks to hours, satisfies examiners by design, and runs on the Microsoft 365 license bundle most institutions already own. The discipline is sequencing and governance, not procurement.
Data as an Operating Discipline, Not a Report
Financial institutions that treat data as an operating discipline gain compounding advantages. Each quarter of clean, connected data makes the next quarter's analysis more powerful. Trends that took months to spot become visible in days. Decisions that required committee meetings happen in real time. Examination preparation stops being a quarterly project and starts being a status check.
The institutions that continue to run on stale spreadsheets and gut instinct are giving away margin to the ones that do not. In a mortgage market where production costs hit $11,898 per loan in Q1 2026 and the digital mortgage software industry is growing at 16.8 percent annually, the operational gap between data-driven institutions and report-driven institutions is widening every quarter. The institutions that close the gap fastest are the ones that build a Microsoft Fabric and Power BI practice as a platform investment rather than a reporting project.
Key Takeaway
Business intelligence pays back fastest when it is built as a platform: OneLake as the data foundation, Power BI as the visible layer, Microsoft Purview as the governance overlay, and Microsoft Entra ID and Row-Level Security as the access model. The five-phase rollout produces a visible dashboard within four to six weeks, a full-funnel view within ninety days, and an examiner-ready compliance reporting environment within one hundred and eighty days. Institutions that try to skip the foundation produce a report portfolio that disagrees with itself. Institutions that build the foundation first ship every subsequent dashboard in a fraction of the time.
From Microsoft 365 Tenant to a Connected Data Platform
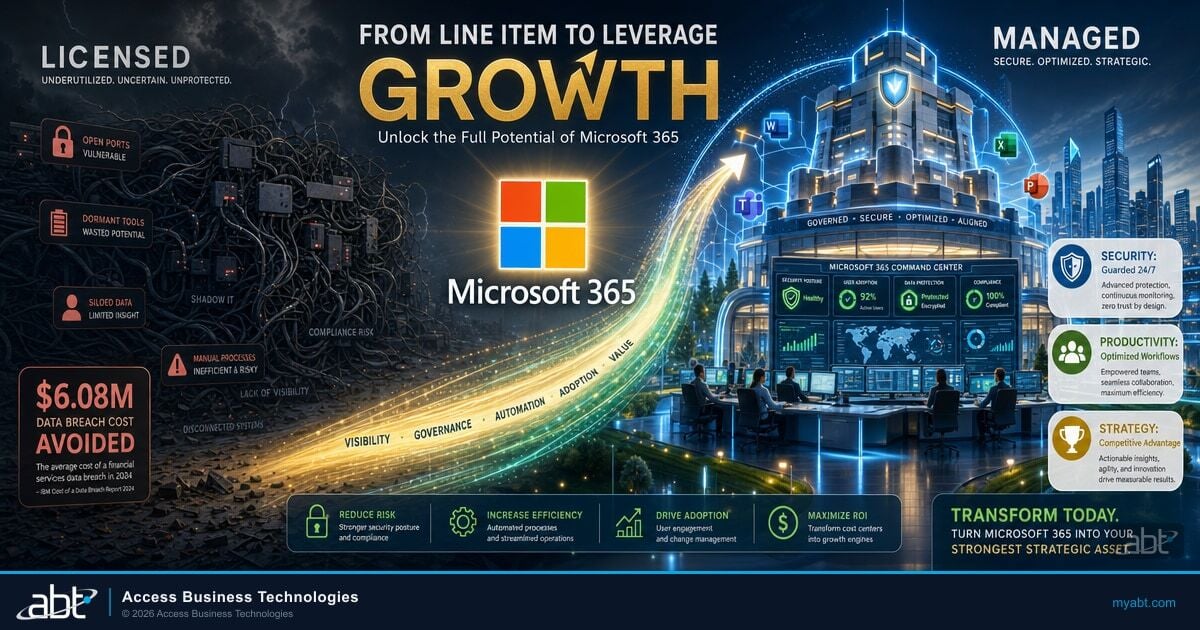
Most financial institutions already own most of the Microsoft Fabric and Power BI licensing they need. The work is in the OneLake foundation, the governance configuration, and the dashboard sequencing. ABT runs Microsoft Fabric and Power BI environments inside the same Microsoft 365 tenants we already manage for 750-plus banks, credit unions, and mortgage companies. The OneLake foundation, the Purview governance, and the Mortgage BI templates ship together as a managed practice rather than a one-time project.
That layered model has a name: M365 Guardian. Microsoft Power BI, Microsoft Fabric, OneLake, and Microsoft Purview are the Microsoft baseline. Guardian is ABT's operating model on top of that baseline for regulated banks, credit unions, and mortgage companies. For a financial institution, the Guardian layer includes FI-tuned Microsoft Sentinel detection rules calibrated to fraud and exfiltration patterns specific to lending and deposit operations, Microsoft Purview audit and DLP policies aligned to HMDA, fair lending, and BSA/AML evidence expectations, Row-Level Security templates configured against the FI's branch and lender hierarchy, a 24/7 security operations center that watches BI report access and export activity alongside the rest of the M365 signal flow, and the Mortgage BI template library pre-built for ICE Encompass, Calyx PointCentral, and the major core banking platforms. The institution keeps its Microsoft 365 licensing and retains its tenant ownership. The Guardian layer is added through the partner relationship.
Frequently Asked Questions
Microsoft Power BI on top of Microsoft Fabric and OneLake is the strongest fit for banks, credit unions, and mortgage companies already running Microsoft 365. Power BI Pro licenses cost $14 per user per month as of April 1, 2025 and remain the standard rate in 2026. Power BI integrates natively with Microsoft Entra ID for authentication, applies Microsoft Purview policies to datasets automatically, and inherits the security and compliance posture of the Microsoft 365 tenant. Microsoft Fabric provides the unified data foundation that prevents the report sprawl problem that disconnected dashboards create.
Microsoft Fabric is a unified analytics platform that combines data engineering, data warehousing, real-time analytics, business intelligence, and AI workloads on a shared data foundation called OneLake. Power BI is the visualization and dashboarding layer that runs on top of Fabric. OneLake stores every analytical dataset once and every Fabric workload reads from it, eliminating the duplication and reconciliation problems traditional data warehouses produce. Microsoft Fabric passed 31,000 paying customer organizations in March 2026, making it the fastest-growing data platform in Microsoft's history.
Start with five metrics on the first dashboard. Total pipeline volume by loan status, average days in each processing stage trending over time, pull-through rate by loan officer and branch, lock expiration exposure ranked by remaining days, and daily or weekly funding volume against target. Five metrics is enough to drive operational decisions and few enough that the dashboard stays understandable. After the first dashboard is in production and being used daily, expand to compliance reporting, full-funnel marketing-to-funded conversion, and cost-to-originate analysis.
Power BI connects to most loan origination systems and core banking platforms through ODBC, direct SQL database connections, or REST API connectors. For institutions on Microsoft Fabric, the recommended pattern is to land source data in OneLake through Fabric Data Factory pipelines and then build Power BI reports on top of OneLake tables rather than connecting Power BI directly to the source system. This produces a single data foundation that every report reads from, prevents the source system from being overloaded by ad-hoc dashboard queries, and gives Microsoft Purview a single place to apply governance policies.
A Power BI compliance workspace connected to the loan origination system monitors HMDA data fields across the entire pipeline in real time. The dashboards flag loans with missing demographic data, inconsistent geographic codes, or incomplete action-taken reasons before year-end reporting deadlines. Fair lending visualizations show approval rates, pricing, and terms across demographic groups to identify potential disparities before they become regulatory findings. Microsoft Purview applies retention policies and audit logging to the underlying data, which provides the documentation examiners and external auditors expect to see.
Data governance for a financial institution BI program establishes who can publish reports, how data refresh schedules are managed, how data quality issues get escalated, and who owns each dashboard. It includes Microsoft Entra ID-backed access groups, Power BI Row-Level Security so branch managers see only their branch's data, Microsoft Purview sensitivity labels and retention policies inherited automatically from the Microsoft 365 tenant, and documented data lineage from every dashboard back to the OneLake table and source system that produced the underlying numbers. Without governance, BI environments produce conflicting metrics that examiners cite and that operating leaders stop trusting.
Technical Reference
Microsoft Power BI: The visualization, dashboarding, and self-service analytics product within the Microsoft Power Platform. Power BI Pro is the standard per-user license at $14 per user per month as of April 1, 2025, with Premium Per User available at $24 per user per month for larger dataset and refresh requirements.
Microsoft Fabric: The unified software-as-a-service analytics platform that combines data engineering, data warehousing, real-time analytics, business intelligence, and AI workloads on a shared foundation called OneLake. Generally available since November 2023, Fabric reached 31,000 paying customer organizations in March 2026.
OneLake: The unified logical data lake built on Azure Data Lake Storage that comes automatically with every Microsoft Fabric tenant. OneLake stores analytical data once and lets every Fabric workload read from it without copying or moving data.
DirectQuery: A Power BI connection mode that sends queries to the source database in real time rather than importing data snapshots. Provides live data freshness at the cost of slightly slower dashboard performance compared to Import mode. Recommended for pipeline dashboards where current data matters more than rendering speed.
Row-Level Security (RLS): A Power BI feature that restricts data access based on user identity. In financial institution operations, RLS ensures branch managers see only their branch's loans and loan officers see only their own pipeline, while executives see the full company view from the same underlying dashboard and data foundation.
Microsoft Purview: The Microsoft 365 governance and compliance suite that applies sensitivity labels, retention policies, data loss prevention rules, and audit logging across Exchange, SharePoint, OneDrive, Teams, and BI workloads including Power BI datasets.
HMDA (Home Mortgage Disclosure Act): Federal legislation requiring mortgage lenders to report loan-level data on applications and originations, including borrower demographics, geographic location, loan terms, and action taken. Annual HMDA reporting requires complete and accurate data across all reportable transactions.
Pull-Through Rate: The percentage of loan applications that reach funded status, calculated as funded loans divided by total applications over a given period. A key mortgage production efficiency metric typically tracked by branch and loan officer in BI dashboards.
ETL and ELT: Data integration patterns for moving data from source systems into a BI environment. ETL (Extract, Transform, Load) transforms data before loading; ELT (Extract, Load, Transform) lands raw data first and transforms inside the analytics platform. Microsoft Fabric supports both patterns through Data Factory pipelines and notebook-driven transformations against OneLake.