In This Article
- Why Cost Per Transaction Matters for Banks, Credit Unions, and Mortgage Companies
- Subscription Pricing for FI Platforms: Predictability That Cuts Both Ways
- Transaction Pricing: Variable Cost That Compounds in Peak Cycles
- Hidden Costs Most Platform Vendors Will Not Volunteer
- The Hybrid Model: Why Established Financial Institutions Are Adopting It
- Break-Even Math: Choosing the Right Model for Your Volume
- The Microsoft Licensing Parallel: Per-Seat Pricing Meets Per-Transaction Economics
- Making the Decision Under FFIEC Vendor Management Expectations
- The ABT Integration Spine: MortgageExchange, Calyx PointCentral, and Mortgage BI
- Frequently Asked Questions
Freddie Mac's 2025 cost-to-originate update puts the retail-only mortgage cost at approximately $11,800 per loan, with full Loan Product Advisor digital capabilities saving up to $1,700 per loan for lenders that maximize them. That is a 13 percent improvement over 2024 savings. Banks and credit unions running consumer and commercial loan platforms face the same arithmetic in a different shape: the headline platform fee tells you almost nothing about your true cost per closed loan, per active member, or per booked account.
The gap between sticker price and per-transaction reality is the entire story of financial institution platform economics. Technology investment measurably reduces unit costs, but only when the pricing model fits how your operation actually runs. A platform that costs fifty dollars per loan at two hundred monthly closings costs one hundred and twenty-five dollars per loan at eighty closings. A core banking module priced as a flat subscription looks cheap when deposits are growing and expensive the moment a competitor takes a chunk of your member base.
This guide breaks down how subscription, transaction, and hybrid pricing models work for the platforms that banks, credit unions, and mortgage companies actually run, with the math behind each approach and the FFIEC vendor management implications that examiners now expect you to document.
Why Cost Per Transaction Matters for Banks, Credit Unions, and Mortgage Companies
Platform vendors quote monthly fees, annual contracts, per-user pricing, and tiered packages. None of those numbers mean anything until you divide your total technology cost by the number of transactions the platform actually produces. For a mortgage company, that denominator is closed loans. For a community bank, it is booked deposit accounts plus funded consumer and commercial loans. For a credit union, it is active members plus loans originated. The metric changes; the discipline does not.
At an $11,800 retail-only cost to originate, technology typically lands inside an eight to twelve percent share of total production cost for a mortgage operation. For a community bank, Cornerstone Advisors reports that information technology consumed an increasing share of operating budgets through 2024 and 2025, with seventy percent of banks and credit unions planning to grow IT spend in 2025. The same Cornerstone research notes that a meaningful portion of new technology budget is going to artificial intelligence and digital banking modernization, not to core platform fees alone.
The challenge for every financial institution is that volume fluctuates. Mortgage closings move with interest rates. Commercial loan demand moves with business sentiment. Deposit growth moves with rate competition and local economics. A pricing model that works at peak production can crush margin during a downturn. The right model absorbs swings without turning your technology into the largest variable expense on your income statement.
The Core Idea
Sticker price is a marketing number. Per-transaction cost across your full volume range is the operating number. Banks, credit unions, and mortgage companies that buy on sticker price almost always overpay during slow quarters and undermanage hidden fees during fast ones.
Subscription Pricing for FI Platforms: Predictability That Cuts Both Ways
Subscription pricing gives you a fixed monthly or annual technology cost regardless of transaction volume. For financial planning, this is appealing. Your CFO knows exactly what the technology line will be next quarter, next year, and through the contract term. Asset and liability committees like predictable fixed costs because they make net interest margin modeling easier.
The economics work in your favor when volume is high and consistent. A ten thousand dollar monthly subscription at two hundred loans per month costs fifty dollars per loan. At four hundred loans per month during a refinance surge, that drops to twenty-five dollars per loan. Your technology investment becomes more efficient as you grow. The same logic applies to a core banking module charged at a flat monthly rate when account counts climb.
The economics reverse when volume drops. That same ten thousand dollar subscription at eighty loans per month costs one hundred and twenty-five dollars per loan. During a slow market, your fixed technology costs consume a larger share of an already thinner spread. Most subscription contracts include minimum terms and annual escalators that prevent meaningful scaling back during downturns.
Subscription works best when:
- Your operation processes consistent monthly volume with less than thirty percent seasonal variation
- You are on a growth trajectory where per-transaction costs decrease as your book expands
- You value budget predictability over cost flexibility, especially for ALCO and FFIEC IT Strategic Plan reporting
- You want comprehensive feature access without per-event add-on fees that complicate forecasting
Most modern loan origination systems used by banks, credit unions, and mortgage companies default to subscription pricing for the platform shell, then layer transaction fees on top of that base for variable services. That layering is the source of most pricing surprises.
Transaction Pricing: Variable Cost That Compounds in Peak Cycles
Transaction pricing charges per loan, per document processed, per credit pull, per booked account, or per some combination of activities. When business slows, your technology costs drop proportionally. No monthly minimums eat into slim margins during the quarters when commercial loan demand softens or refinance volume disappears.
The math sounds clean until you examine the fee structure in detail. A seventy-five dollar per-loan platform fee at two hundred loans per month costs fifteen thousand dollars monthly. Straightforward. Add eight dollars per credit pull at three pulls per loan average, five dollars per document verification, twelve dollars per compliance check, and fifteen dollars per investor delivery, and your actual per-loan cost reaches one hundred thirty to one hundred fifty dollars. The headline price barely represents half the real cost. ICE Mortgage Encompass, for example, has historically offered a success-based pricing option that charges per closed loan with no upfront fees, but the per-loan number on the contract page is rarely the all-in number on the invoice.
The headline price on a transaction-based platform contract usually represents fifty to sixty percent of the all-in per-transaction cost. The remainder lives in add-on fees that nobody surfaces until you start running real volume.
Transaction pricing also creates a perverse incentive during high-volume periods. When a refinance wave hits or commercial loan demand surges, your technology costs scale with your volume rather than amortizing over a fixed base. Your revenue increases, but your platform vendor captures a proportionally larger share of the incremental margin. For credit unions navigating a fee-compression environment under NCUA's continued focus on consumer financial protection, this dynamic matters more than it did a decade ago.
Transaction pricing works best when:
- Your transaction volume fluctuates more than fifty percent between peak and slow months
- You are a startup, smaller institution, or new product line testing market demand
- You prefer minimal upfront commitment and can tolerate cost unpredictability quarter to quarter
- You process fewer than fifty transactions per month per platform module, where subscription minimums drive per-unit costs uneconomically high
Hidden Costs Most Platform Vendors Will Not Volunteer
Every pricing conversation should include the questions below. Most vendors will not volunteer the answers, and most contract redlines will not surface them either unless you ask in writing. These costs apply equally to mortgage loan origination platforms, core banking modules used by community banks and credit unions, and the digital banking layers that sit on top.
- Implementation and migration costs. Moving a mortgage company between LOS vendors typically lands at fifty thousand to one hundred thousand dollars in true implementation cost for a mid-size lender, including data migration, custom configuration, integration setup, and staff training. Core banking conversions for a community bank or credit union routinely run multiples of that figure. These costs are rarely included in the quoted platform price. Always request a total first-year cost projection that includes implementation, conversion, and parallel-run expenses.
- Per-user add-on charges. Some subscription platforms quote a base price covering a limited number of named users. Additional loan officers, processors, underwriters, member service representatives, or compliance analysts cost extra. If you add staff during a growth phase, your "predictable" subscription quietly grows with every hire. The all-in cost only stabilizes once your headcount stabilizes.
- Storage and data retention fees. Loan files are large. Document images, appraisal reports, income verification records, deposit account statements, and BSA compliance documentation add up fast. Some platforms charge overage fees when storage exceeds the plan limit, and those overages compound year over year because regulatory retention requirements prevent you from purging old records. SEC Rule 17a-4, FINRA 4511, and BSA 31 CFR Part 1010 all impose multi-year retention windows.
- Integration and API fees. Connecting your platform to credit bureaus, income verification services, document management systems, your core banking system, and your fintech partners sometimes carries per-connection or per-call charges separate from the core subscription. As Section 1033 open banking requirements push more institutions toward standardized API exposure, the per-call costs on those connections become a real line item.
- Contract termination penalties. Leaving a subscription platform before the term ends triggers early termination fees. Some contracts calculate these as the remaining balance of the full term. If your platform is not working at month six of a thirty-six month contract, you are paying for thirty months of software you will not use. FFIEC IT Strategic Plan guidance now expects institutions to document realistic exit costs as part of vendor risk assessments.
- Premium support and training tiers. Standard support hours often exclude evenings and weekends, when your closing teams or after-hours member service operations actually need help. Premium support tiers add ten to twenty percent to platform cost. Training credits frequently expire annually, so an institution that does not consume them loses the budget without recovering value.
Credit unions in particular tend to underweight implementation cost when making vendor decisions. A focused look at how credit unions reduce all-in loan origination cost typically reveals that platform fees are a smaller line item than process inefficiency, but the implementation cost of switching platforms is often the single largest barrier to fixing the inefficiency.
The Hybrid Model: Why Established Financial Institutions Are Adopting It
The financial institution technology market is moving toward hybrid pricing that combines subscription stability with transaction flexibility. This approach addresses the weaknesses of both pure models and is now the structure offered by most large LOS vendors and a growing number of core banking providers.
A typical hybrid structure includes a base subscription fee for core platform access, named user licenses, standard integrations, and baseline storage. Transaction fees apply on top for variable-cost services like credit pulls, fraud checks, document verification, and investor or core delivery. The base covers your fixed technology overhead. The transaction fees scale with actual business activity. The result is a curve that flattens both the slow-month penalty of pure subscription and the peak-month surcharge of pure transaction pricing.
For a mid-size mortgage operation processing one hundred fifty to three hundred loans per month, a hybrid LOS arrangement might look like:
| Component | Cost Range | What It Covers |
|---|---|---|
| Monthly base subscription | $5,000 to $7,000 | Core LOS, named user licenses, standard CRM and compliance modules |
| Per-loan variable fee | $20 to $35 per loan | Credit pulls, document verification, fraud checks, investor delivery |
| Total at 200 loans/month | $9,000 to $14,000/month | Effective $45 to $70 per loan all-in |
| Total at 100 loans/month | $7,000 to $10,500/month | Effective $70 to $105 per loan all-in |
| Total at 300 loans/month | $11,000 to $17,500/month | Effective $37 to $58 per loan all-in |
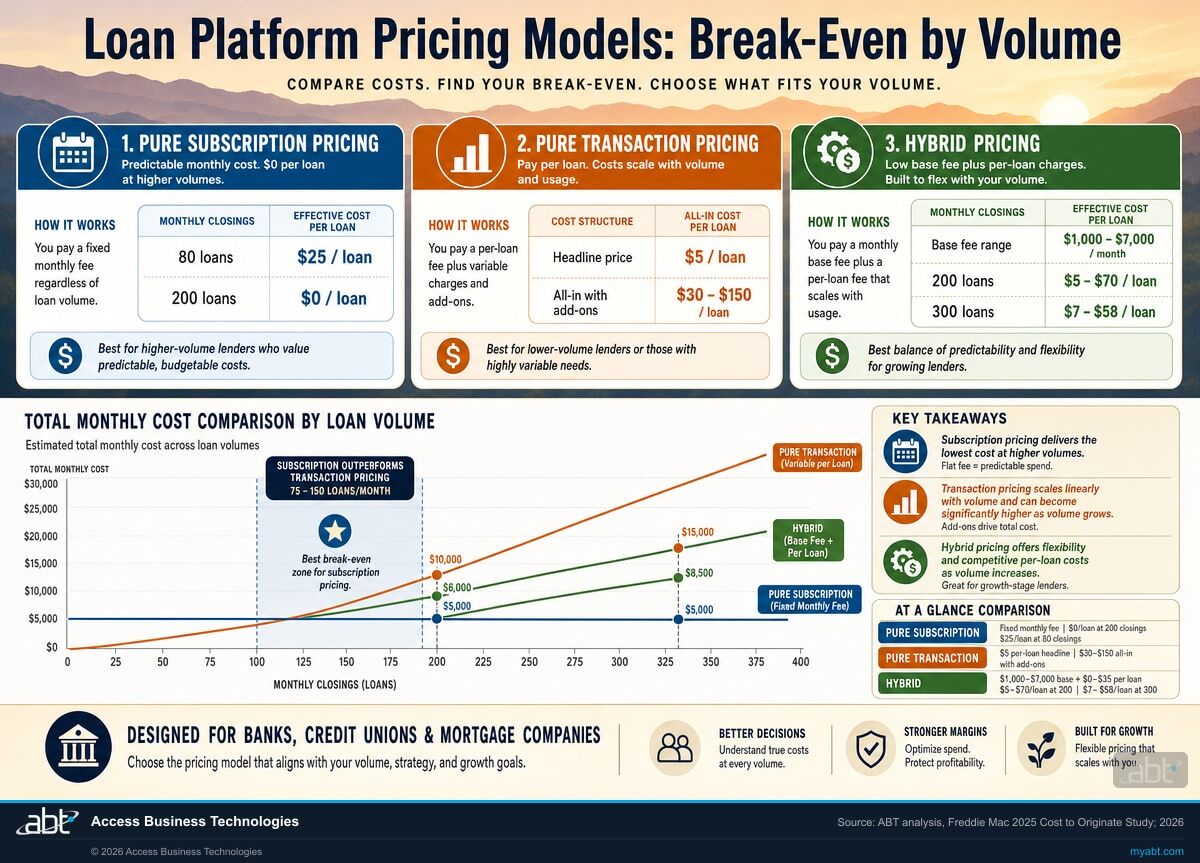
Community banks and credit unions running consumer loan platforms see similar curves with different scale factors. A consumer LOS hybrid for an institution funding eight hundred to fifteen hundred consumer loans per month often runs three thousand to five thousand dollars in base subscription with ten to twenty dollars per booked loan in variable services. A core banking deposits module typically prices on a per-account basis with a fixed minimum and an enterprise license cap above a defined account count.
The base subscription prevents per-unit cost from spiking dramatically during slow months the way a pure subscription model would, while the transaction component keeps total costs from inflating during high-volume periods the way a pure transaction model would. This balance is why hybrid pricing is becoming the default for established financial institutions across the bank, credit union, and mortgage segments.
Want a Total Cost of Ownership Analysis Across Your Platform Stack?
ABT helps banks, credit unions, and mortgage companies model the all-in per-transaction cost of their LOS, core banking, and digital banking platforms against current vendor proposals. Start with a TCO review and pricing benchmark against your peer set.
Break-Even Math: Choosing the Right Model for Your Volume
The break-even point between subscription and transaction pricing depends on your monthly transaction volume and the specific fee structures being compared. The math is identical whether you are pricing a mortgage LOS, a consumer loan platform, or a core banking module. Only the units change.
Step one: calculate your fully loaded transaction cost. Multiply your average monthly volume by the all-in per-transaction cost, including every add-on fee, not just the headline price. This is your maximum monthly spend under a transaction model. Most institutions running this calculation for the first time discover that the all-in number is forty to sixty percent higher than the contract sticker.
Step two: calculate your true subscription total. Add every component of the subscription cost: base fee, per-user charges, storage fees, integration fees, support tier, and the annualized cost of any one-time implementation that is being amortized in your accounting. This is your actual monthly spend under a subscription model.
Step three: find the crossover point. At what monthly volume does the transaction total equal the subscription total? Above that volume, subscription is cheaper per transaction. Below it, transaction is cheaper. For most mid-market mortgage lenders, the crossover sits between seventy-five and one hundred fifty loans per month. Below seventy-five, transaction pricing almost always wins. Above one hundred fifty, subscription almost always wins. The middle band is where careful analysis of your seasonal pattern, growth trajectory, and cost tolerance determines the right answer.
Freddie Mac's data reinforces the stakes for mortgage operations specifically. At an eleven thousand eight hundred dollar cost to originate, even a twenty dollar per-loan reduction in technology costs produces forty-eight thousand dollars in annual savings at two hundred loans per month. For a community bank with fifteen hundred deposit-account openings and one thousand consumer loans per month, a five dollar per-transaction reduction across both flows produces one hundred fifty thousand dollars in annual savings. The pricing model decision is a real margin lever, and FFIEC examiners increasingly expect IT Strategic Plan documentation to show that the math has been done.
The Microsoft Licensing Parallel: Per-Seat Pricing Meets Per-Transaction Economics
The same per-unit thinking that should drive loan platform decisions applies to your Microsoft 365 estate, where the unit is the licensed seat rather than the booked transaction. Microsoft 365 Business Premium currently lists at twenty-two dollars per user per month. Microsoft 365 E3 lists at thirty-six dollars and is rising to thirty-nine dollars per user per month effective July 1, 2026. Microsoft 365 E5 lists at fifty-seven dollars and is rising to sixty dollars per user per month effective the same date. The base layer of your collaboration, security, and compliance stack follows the same subscription logic that your loan platform vendor uses, with predictable fixed costs that scale with headcount rather than transaction volume.
Microsoft 365 list pricing is set centrally, but the way it interacts with your loan and core banking platform decisions is institution-specific. Most financial institutions running Microsoft 365 E3 are paying for security and compliance capabilities (Microsoft Defender for Office, Purview Data Lifecycle Management, Conditional Access) that overlap with capabilities sold separately by their LOS or core banking vendor. ABT's license-optimization analysis routinely identifies thirty to fifty percent of an institution's add-on platform spend as duplicative coverage of features already paid for inside Microsoft 365. The parallel matters for budgeting: subscription pricing decisions on the Microsoft side directly change the value of subscription versus transaction pricing decisions on the loan platform side, because the all-in cost of compliance and security capabilities depends on which contract you bought them in.
The point is not that Microsoft licensing replaces a loan platform decision. The point is that financial institutions evaluating subscription versus transaction loan platform pricing should run the same calculus on their Microsoft 365 estate at the same time, because the answers are correlated. A clear comparison of Microsoft 365 E3, E5, and Business Premium for financial institutions often surfaces budget that can fund the right loan platform pricing model rather than the cheapest one. The same logic explains the timing pressure around Microsoft Copilot pricing decisions for banks, where the per-user-per-month commitment becomes the new fixed-cost layer that interacts with every other variable platform expense.
Making the Decision Under FFIEC Vendor Management Expectations
The pricing model matters, but it is one variable inside a larger total cost of ownership calculation that FFIEC examiners now expect institutions to perform formally. The 2023 Interagency Guidance on Third-Party Relationships: Risk Management requires banks and savings institutions to document a risk-tiered, full-lifecycle assessment of every material vendor relationship. The Management booklet of the FFIEC IT Handbook treats vendor TCO and exit cost as part of strategic planning, not as a procurement detail.
What Examiners Expect to See
For any platform vendor classified as critical or significant under your third-party risk management program, your file should include: a documented total cost of ownership analysis at three volume scenarios (base, peak, trough); an exit cost calculation including data extraction, parallel run, and termination fees; a contract review summary covering price escalation clauses, audit rights, and incident notification timelines; and a vendor concentration analysis showing how this platform interacts with your other critical vendors. None of these documents are optional under the 2023 Interagency Guidance for institutions of any size.
A subscription platform that reduces processing time by thirty percent and eliminates two FTE positions delivers better economics than a cheaper transaction platform requiring manual workarounds and additional staff, even if the headline price is higher. The companies that thrive are not on the cheapest platform. They are on the right platform for their volume profile, growth plan, and compliance posture, and they can show their work to an FFIEC, OCC, FDIC, or NCUA examiner without panicked reconstruction the night before the entrance interview.
Access Business Technologies helps banks, credit unions, and mortgage companies evaluate platform options based on total cost of ownership, not vendor pricing sheets. Our team has guided more than seven hundred fifty financial institutions through technology decisions, from LOS and core banking selection through integration architecture, vendor risk documentation, and pricing negotiation. The institutions that get this right do not just save money. They produce the vendor management documentation FFIEC examiners now expect, without scrambling.
The ABT Integration Spine: MortgageExchange, Calyx PointCentral, and Mortgage BI
The pricing-model conversation is incomplete without the integration conversation underneath it. A subscription LOS that delivers loans the credit union core cannot ingest produces the same operational cost as a transaction LOS at peak volume. The real lever is whether the platform fits into a working integration spine. ABT runs that spine for community banks, credit unions, and mortgage operations through three pieces that together address both the integration cost most vendors hide and the platform-hosting choice most institutions never realize they have. MortgageExchange is the custom interface that connects the LOS, whether you are running ICE Encompass, Calyx Point, Calyx PointCentral, or another vendor, to your core banking platform (Fiserv DNA, Symitar Episys, Jack Henry Silverlake, or Corelation Keystone) without the per-call API fees that show up on a hybrid-pricing invoice. The interface produces the daily reconciliation files, the booked-loan handoffs, and the document indexing that examiners read inside the FFIEC Management booklet. Calyx PointCentral is the LOS most credit-union and community-bank lenders choose for cost discipline, and ABT hosts dedicated PointCentral instances on Microsoft Azure under our partner-of-record subscription, which means the institution avoids the on-prem hardware refresh cycle and the build-it-yourself security posture that comes with PointCentral self-hosting. The hosted PointCentral arrangement is a subscription-economics decision the institution gets to make once, and the per-loan cost ceiling stays predictable as long as the operation runs.
The third piece is Mortgage BI, ABT's business-intelligence layer that pulls from MortgageExchange, the LOS, and the core to produce the per-transaction cost dashboards the FFIEC IT Strategic Plan now expects institutions to show during examinations. Mortgage BI is how a community-bank CFO answers "what did our last hundred loans actually cost us in technology plus labor plus compliance overhead" without spending a quarter assembling the spreadsheet. Sitting underneath the whole spine is M365 Guardian, ABT's operating model over Microsoft 365 Defender, Purview, Entra ID, Intune, and Sentinel for community banks, credit unions, and mortgage operations. ABT manages the Microsoft 365 tenant under delegated admin (Microsoft owns the M365 infrastructure; ABT manages the tenant), hosts the Azure environment that runs PointCentral and MortgageExchange (Azure subscriptions are customer-controlled cloud infrastructure ABT operates as partner of record), and produces the cross-platform audit evidence the institution's vendor-management file needs without the institution running multiple separate vendor relationships. Subscription versus transaction pricing matters. The integration spine and the operating model around it matter more.
Build a Defensible Platform Pricing Decision Before Your Next Examination
ABT runs total-cost-of-ownership and vendor risk reviews aligned to the 2023 Interagency Guidance on Third-Party Relationships and FFIEC Management booklet, anchored to the MortgageExchange integration spine, Calyx PointCentral hosting, Mortgage BI dashboards, and M365 Guardian. Walk into your next exam with the documentation already done.
Frequently Asked Questions
Add every technology cost including subscription fees, per-transaction charges, per-user licenses, storage fees, integration costs, and support charges. Divide that total by the number of transactions completed in the same period. For a mortgage company, transactions are closed loans. For a community bank, they are funded loans plus booked deposit accounts. For a credit union, they are funded loans plus active members. Compare this number across at least three months with different volume levels to understand how your per-transaction cost fluctuates. The true cost at your lowest volume month is your worst-case technology economics and the figure FFIEC examiners want to see in your IT Strategic Plan documentation.
Freddie Mac's 2025 cost-to-originate analysis puts the average at approximately eleven thousand eight hundred dollars per loan for retail-only lenders in Q2 2025, an improvement from thirteen thousand four hundred dollars in Q1 2025. The figure includes all production expenses including personnel, technology, occupancy, and administrative costs. Technology typically represents eight to twelve percent of the total. Lenders maximizing Freddie Mac Loan Product Advisor digital capabilities including the asset and income modeler, automated collateral evaluation, and collateral representation and warranty relief report savings of up to one thousand seven hundred dollars per loan, a thirteen percent improvement over 2024.
The crossover point for most mid-market mortgage lenders falls between seventy-five and one hundred fifty loans per month, depending on the specific fee structures compared. For consumer loan platforms used by community banks and credit unions, the crossover typically sits at five hundred to one thousand monthly bookings because the per-loan fees are lower. Below the crossover, transaction pricing usually costs less because subscription fees produce a high per-unit cost. Above the crossover, subscription pricing almost always wins because the fixed cost distributes across enough volume to beat per-transaction charges. Always run the math against your slow-quarter volume, not your average, since that is when subscription cost discipline matters most.
Look beyond the headline price for implementation and data migration fees that often run fifty thousand to one hundred thousand dollars or more for a mid-size lender, per-user charges above the base tier, data storage overage costs that compound under multi-year regulatory retention requirements, API and integration connection fees, premium support tier pricing for after-hours coverage, and early contract termination penalties that can reach the remaining balance of a multi-year contract. Request a total first-year cost projection at your expected usage level including all components. The difference between quoted price and fully loaded price often exceeds forty percent, and FFIEC examiners increasingly expect you to have documented this difference inside your vendor management file.
Hybrid pricing works well for institutions with seasonal swings because the base subscription covers fixed technology overhead at a predictable cost while transaction fees scale with actual volume. During slow months, the base fee prevents per-unit cost from spiking dramatically. During peak months, the transaction component keeps total cost lower than a subscription sized for peak capacity would be. Most established mortgage companies processing one hundred or more loans per month are now adopting hybrid structures, and core banking and consumer lending vendors are following the same pricing pattern. The exception is institutions with very low or very high volume relative to the platform's typical user base, where pure transaction or pure subscription pricing usually wins outright.
Most loan platform vendors sell add-on modules for security, compliance, document management, and analytics that overlap directly with capabilities already included in Microsoft 365 E3 and E5. Institutions paying twenty-two dollars per user per month for Business Premium, thirty-six dollars for E3 (rising to thirty-nine in July 2026), or fifty-seven dollars for E5 (rising to sixty in July 2026) often duplicate that coverage by buying the same capability inside the loan platform contract. Running the loan platform pricing decision and the Microsoft license optimization decision together commonly identifies thirty to fifty percent of platform add-on spend as duplicative. The two decisions should be evaluated as one budget exercise rather than as separate procurement events.
Under the 2023 Interagency Guidance on Third-Party Relationships: Risk Management and the FFIEC Management booklet, every critical or significant platform vendor file should contain a documented total cost of ownership analysis at three volume scenarios (base, peak, trough), an exit cost calculation including data extraction and parallel-run expenses, a contract review summary covering price escalation clauses, audit rights, and incident notification timelines, and a vendor concentration analysis showing how the platform interacts with your other critical vendors. The same expectations apply to community banks supervised by FDIC and OCC and any savings institution covered by the Interagency Guidance, regardless of asset size.